8
$\begingroup$

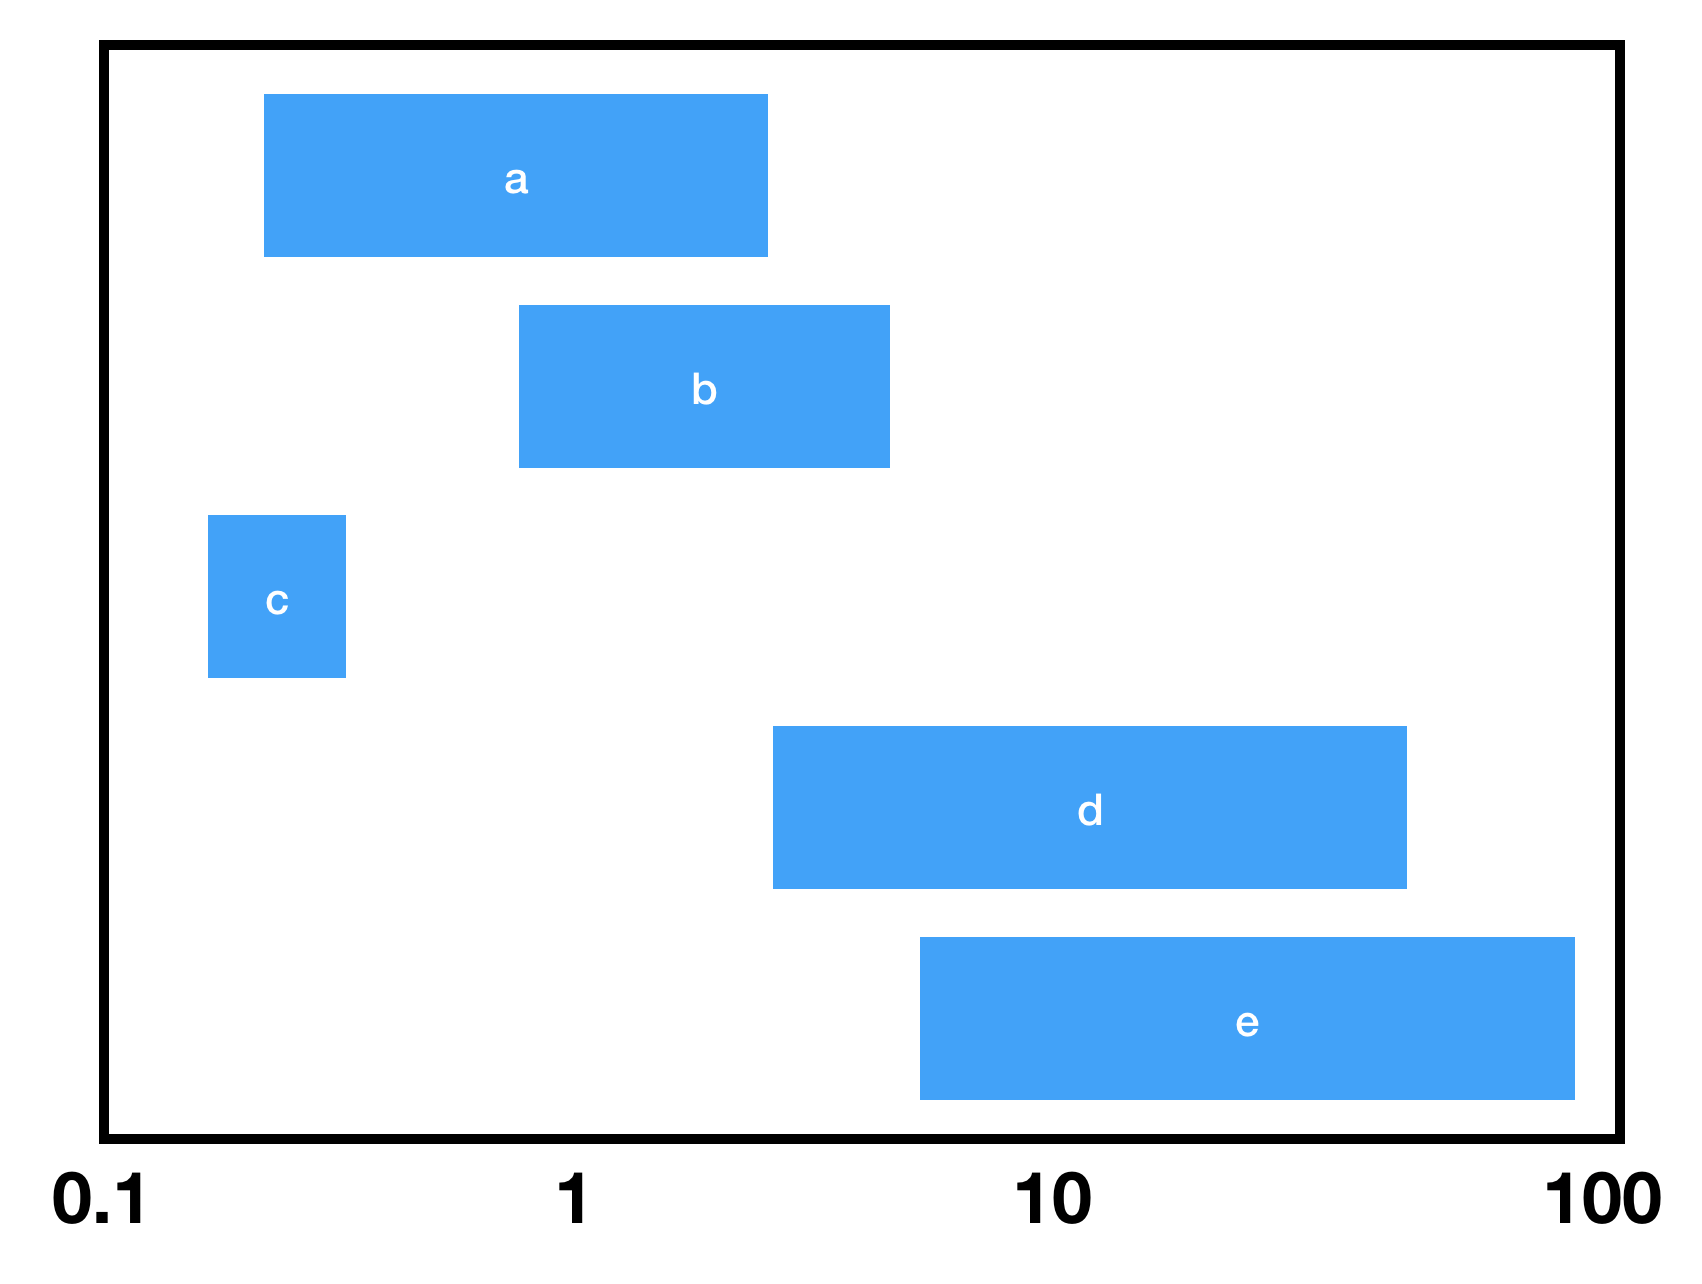
I need to plot something that looks like a gant chart, but are actual data ranges. These ranges need to be on a log scale. Graphics does not offer a Scalingfunction. A LogPlot with ErrorBars does not work either and would not look ideal. Is it possible to draw rectangles with one axis being log scale?

E.g.: Min and Max values of the rectangles are the known data.

enter image description here

$\endgroup$
1
  • 1
    $\begingroup$ Can you point to an example (even a non-Mathematica example)? $\endgroup$ Commented Mar 15, 2019 at 19:52

3 Answers 3

12
$\begingroup$
SeedRandom[1]
dates = Sort /@ RandomInteger[{10, 1000}, {5, 2}];
data = MapIndexed[Thread@{#, #2[[1]]} &, dates];
labels = CharacterRange["A", "E"];
data2 = MapIndexed[Labeled[{#, #2[[1]]}, Style[labels[[#2[[1]]]], White,
  FontSize -> Scaled[.03]], Center] &, GeometricMean /@ dates];

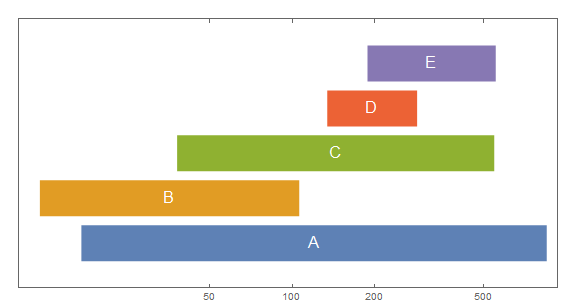
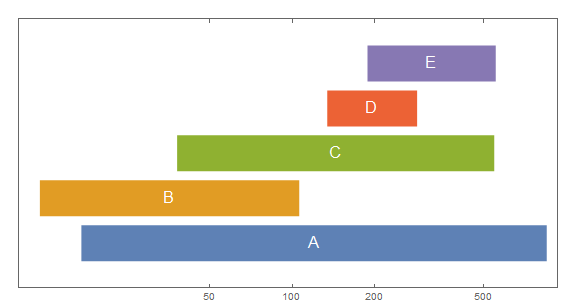
ListLogLinearPlot

Show[ListLogLinearPlot[data,  
  BaseStyle -> Directive[AbsoluteThickness[36], CapForm["Butt"]],  
  Joined -> True, AspectRatio -> 1/2, ImageSize -> Large, 
  PlotRange -> {0, 6}, Frame -> True, 
  FrameTicks -> {{None, None}, {{50, 100, 200, 500, 1000}, Automatic}}],
 ListLogLinearPlot[data2, PlotMarkers -> ""]]
enter image description here

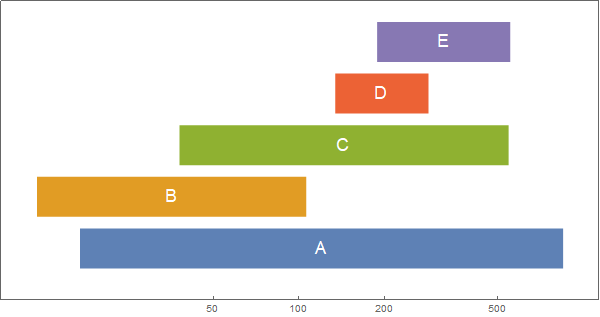
ListLinePlot + ScalingFunctions

ListLinePlot[data,  BaseStyle -> Directive[AbsoluteThickness[36], CapForm["Butt"]], 
 ScalingFunctions -> {"Log", "Linear"}, AspectRatio -> 1/2, 
 ImageSize -> Large, PlotRange -> {0, 6}, Frame -> True, 
 FrameTicks -> {{None, None}, {{50, 100, 200, 500, 1000}, Automatic}}, 
 Epilog -> MapIndexed[Text[Style[labels[[#2[[1]]]], White, 
    FontSize -> Scaled[.03]], {#, #2[[1]]}, Center] &, Log[GeometricMean /@ dates]]]
enter image description here

TimeLinePlot

TimelinePlot[{Labeled[#, Style[#2, White,  FontSize -> Scaled[.03]], Center]} & @@@ 
  Transpose[{Interval /@ (Map[N@*Log, dates, {-1}]), labels}], 
 PlotStyle -> Directive[AbsoluteThickness[40], CapForm["Butt"]], 
 Spacings -> .1, PlotMarkers -> "", Frame -> True, 
 AspectRatio -> 1/2, PerformanceGoal -> "Speed", 
 FrameTicks -> {{Automatic, Automatic}, 
   {Transpose[{Log@#, #} &@{50, 100, 200, 500}], None}}]
enter image description here

BarChart

BarChart[{Style[#[[1]], Directive[EdgeForm[], White]], 
    Labeled[Style[#[[2]], Directive[EdgeForm[], #2]], 
     Style[#3, White, FontSize -> Scaled[.03]], Center]} & @@@ 
  Transpose[{dates, ColorData[97] /@ Range[Length@dates], labels}], 
 BarOrigin -> Left, BarSpacing -> {0, .25}, ChartLayout -> "Stacked", 
 ScalingFunctions -> "Log", Axes -> False, 
 PerformanceGoal -> "Speed", Frame -> True, ImageSize -> Large, 
 PlotRangePadding -> .5, AspectRatio -> 1/2]
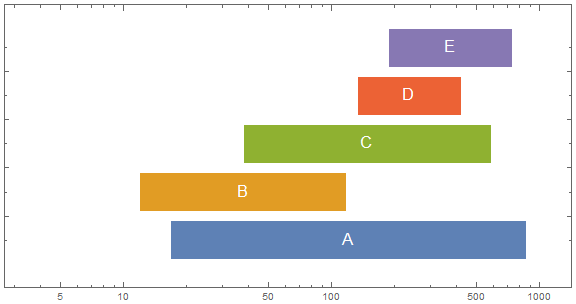
enter image description here

Thanks: @David G. Stork for the GeometricMean idea to center the labels.

See also: Poets of the 19th century

$\endgroup$
2
  • 3
    $\begingroup$ The only needed improvement: take the geometric mean of each bar's endpoints to get the "middle" placement of the letter. Mean is simply incorrect. Try GeometricMean. $\endgroup$ Commented Mar 15, 2019 at 21:24
  • $\begingroup$ Thank you @David! I was struggling with exactly that issue. $\endgroup$
    – kglr
    Commented Mar 15, 2019 at 21:29
6
$\begingroup$
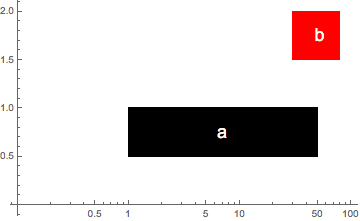
LogLinearPlot[1, 
 {t, .1, 100},
 PlotStyle -> White,
 Epilog -> {Rectangle[{Log[1], .5}, {Log[50], 1}],
   Red, Rectangle[{Log[30], 1.5}, {Log[80], 2}],
   Text[Style["a", White, 18], {Log[7], .75}],
   Text[Style["b", White, 18], {Log[53], 1.75}]}]

Mathematica graphics

$\endgroup$
1
  • $\begingroup$ This is nice, was wondering how to use Rectangle[]. Thank you! $\endgroup$
    – mjw
    Commented Mar 15, 2019 at 21:18
2
$\begingroup$
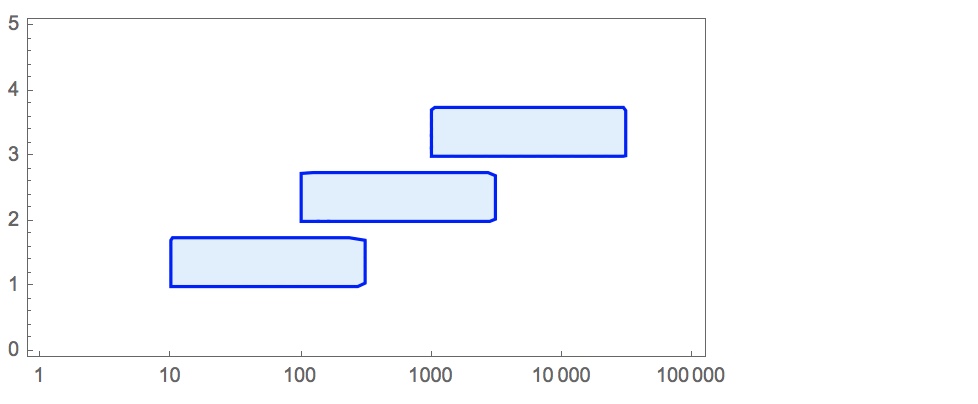
A = 10^5; B = 5;
rectangle[start_, length_, number_] := 
  RegionPlot[Log10[start] <= x <= Log10[start + length] && 
  number <= y <= number + .75, {x, 0, Log10[A]}, {y, 0, B}, 
  PlotStyle -> LightBlue, BoundaryStyle -> Blue]; 
Show[
  rectangle[10, 300, 1], rectangle[100, 3000, 2], rectangle[1000, 30000, 3], 
  FrameTicks -> {Transpose@{Range[0,5], 10^Range[0,5]}, Automatic, None, None}, 
  AspectRatio -> 1/2
]

enter image description here

$\endgroup$
2
  • $\begingroup$ Axis-Ticks should not be a problem. I'll check tomorrow. It's now night here. $\endgroup$ Commented Mar 15, 2019 at 21:02
  • $\begingroup$ Added FrameTicks[]. You are right, not a problem. $\endgroup$
    – mjw
    Commented Mar 17, 2019 at 6:01

Your Answer

By clicking “Post Your Answer”, you agree to our terms of service and acknowledge you have read our privacy policy.

Not the answer you're looking for? Browse other questions tagged or ask your own question.