3
$\begingroup$

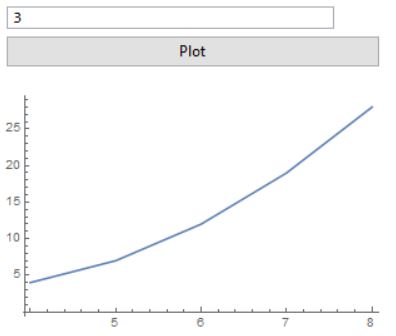
I would like to create a graph using ListPlot which prints new dataset every time the button is evaluated (based on the value given in InputField), by adding the new curve to the one that has been previously plotted, showing multiple curves.

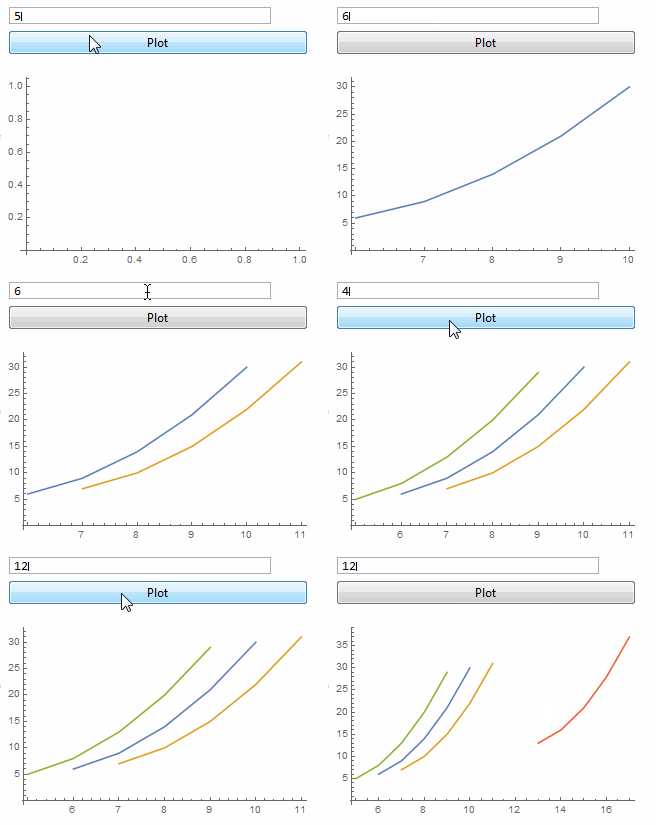
For example: if the button is clicked 5 times, the graph should show 5 curves.

The ListPlot I have here does replace the old dataset with the new one (always showing only one curve) every time the value of InputField is changed and button is re-evaluated, which is not what I want. How to force ListPlot to print the new curve while keeping the old one?

 DynamicModule[{inputValue = 0, dataSet = {}}, 
 Column[{
   InputField[Dynamic[inputValue]], 
   Button["Plot", dataSet = Table[inputValue + i^j, {i, 5}, {j, 2}]], 
   Spacer[5],
   Dynamic@ListPlot[dataSet, Joined -> True, ImageSize -> {300}]
   }]] 

enter image description here

$\endgroup$

1 Answer 1

5
$\begingroup$

Append the new data to your dataSet each time the button is pressed, rather than simply assigning it a new value:

DynamicModule[
 {inputValue = 0, dataSet = {}},
 Column[{
   InputField[Dynamic[inputValue]],
   Button["Plot", AppendTo[dataSet, Table[inputValue + i^j, {i, 5}, {j, 2}]]],
   Spacer[5],
   Dynamic@ListPlot[dataSet, Joined -> True, ImageSize -> {300}]
 }]
]

enter image description here

$\endgroup$
1
  • $\begingroup$ Thanks a lot!, this is exactly what I need :) $\endgroup$
    – Kamila
    Commented Mar 8, 2019 at 18:23

Your Answer

By clicking “Post Your Answer”, you agree to our terms of service and acknowledge you have read our privacy policy.

Not the answer you're looking for? Browse other questions tagged or ask your own question.