0
$\begingroup$

Plot the probability density function

$\qquad w(x)=(1/(1+x^2))(1/x^{0.5})$ for $(0 < x < 1)$

Make up the subroutine flowchart to get the random numbers $x$, using the modified rejection technique with first factor used as the comparison function.

Use the flowchart to get a few random numbers in Wolfram Mathematica

Trial answer:

a = 0; b = 1;
f[x_] := (1/(1 + x^2)) (1/x^0.5)
h = 1; Nt = 1000000;
gr1 = Plot[f[x], {x, a, b}]

S := (
  x = y = b h; 
  While[y > f[x], 
    x = a + (b - a) RandomReal[]; 
    y = h RandomReal[]]; 
  Return[x];
)

rez = Table[S, {i, Nt}];
gr2 = Histogram[rez, Automatic, "PDF"]
Show[gr1, gr2]
$\endgroup$
2
  • 3
    $\begingroup$ There is no question here, I'm afraid. What are you having trouble with? BTW, this sounds pretty obviously a homework assignment of some sort, right? $\endgroup$
    – MarcoB
    Commented Mar 4, 2019 at 17:33
  • $\begingroup$ I don't think w(x) integrates to 1 over the interval (0,1). Do you mean Sqrt[2]/pi w(x) integrated from zero to infinity? $\endgroup$
    – mjw
    Commented Mar 4, 2019 at 17:53

1 Answer 1

3
$\begingroup$

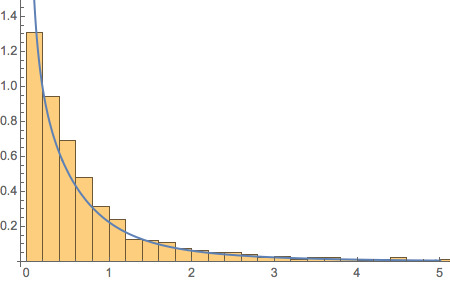
Taking @mjw's correction into account and rewriting your code like so

f[x_] := Sqrt[2]/π/((1 + x^2) Sqrt[x])

a = .0001; b = 100;
gr1 = Plot[f[x], {x, a, 5}, PlotRange -> All];
S :=
  Module[{x, y, h = 1.},
    x = y = b h;
    While[y > f[x],
      x = RandomReal[{a, b}];
      y = h RandomReal[]];
    x]
gr2 = Histogram[Table[S, 1000], Automatic, "PDF"];
Show[gr2, gr1, PlotRange -> {{0, 5}, {0, Sqrt[2]}}]

produces

plot

which seems fairly satisfactory.

$\endgroup$

Your Answer

By clicking “Post Your Answer”, you agree to our terms of service and acknowledge you have read our privacy policy.

Not the answer you're looking for? Browse other questions tagged or ask your own question.