4
$\begingroup$

I looked through the forum but none of what I've found is helping.

f[x_] := Sin[x]; 

Manipulate[  
  circle = 
    {RGBColor[1, 0.27, 0.5], {Circle[{x, f[x]}, y]}, PlotRange -> {{0, 100}, {-5, 5}}};  
  curve = 
    {ParametricPlot[{z, Sin[z]}, {z, 0, 2 Pi}]};  
  box = {RGBColor[0.81, 0.79, 1], Rectangle[{40, 0}, {50, 10}]};  
  Graphics[{box, circle, curve}, PlotRange -> {{0, 50}, {0, 20}}],  
  {x, 0, 50}, 
  {y, 0.5, 5}]

I'm getting the error message:

Graphics is not a Graphics primitive or directive.

Please help.

$\endgroup$
0

2 Answers 2

3
$\begingroup$

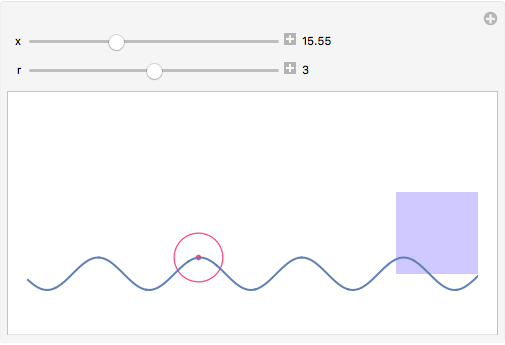
I'm guessing that you want the circle to move along the curve, so your code should be written like this:

f[x_] := 2 Sin[x/2]
Manipulate[
  circle =
    With[{u = x, v = f[x]}, 
      {RGBColor[1, 0.27, 0.5], PointSize[Medium], Point[{u, v}], Circle[{u, v}, r]}];
  Graphics[{box, circle, curve}, PlotRange -> {{-5.5, 50}, {-5.5, 20}}],
  {circle, None},
  {curve, None},
  {box, None},
  {x, 1, 50 - 5.5, Appearance -> "Labeled"},
  {{r, 3}, 1, 5, .5, Appearance -> "Labeled"},
  Initialization :> (
    curve = (ParametricPlot[{z, f[z]}, {z, -5.5, 50}][[1]]);
    box = {RGBColor[0.81, 0.79, 1], Rectangle[{40, 0}, {50, 10}]})]

demo

$\endgroup$
10
$\begingroup$

The reason you are getting this error is that you are including the result of a plotting function inside a Graphics expression. Since plotting functions produce Graphics objects themselves you cannot nest them inside other Graphics expressions. You need to use Show to combine them.

Wrong way:

plot = Plot[x, {x, -2, 2}];
Graphics[{plot, Circle[]}]

Right way:

plot = Plot[x, {x, -2, 2}];
Show[ Graphics@Circle[], plot]
$\endgroup$

Not the answer you're looking for? Browse other questions tagged or ask your own question.