I'm very new with Mathematica, and I'm struggling with a very simple problem.
I want to plot this
ContourPlot[Sqrt[-1 + (4 k^2)/(1 + k^2 Z)^2], {k, 0.4, 2500}, {Z,
  0.001, 1.0}, ClippingStyle -> Automatic,
 ScalingFunctions -> {"Log", "Log", "Log"},
 PlotLegends ->
  BarLegend[Automatic, All,
   LabelingFunction -> (Style[NumberForm[#, 3]] &)], PlotPoints -> 20,
  MaxRecursion -> 4, ColorFunction -> "Rainbow",
 ContourLabels -> False, Contours -> 20,
 FrameLabel -> {"|\!\(\*OverscriptBox[\(k\), \(~\)]\)|", "Z"},
 PlotRange -> {{0.4, 2500}, {.001, 1.2}, {.2, 40}},
 ImageSize -> Medium]
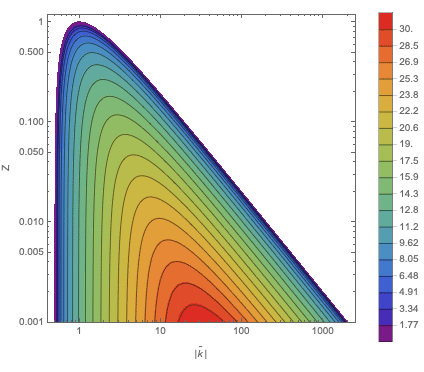
Doing that I obtain this
But I know that the function is always <1 when Z>0.5 which is in contrast with the plot.
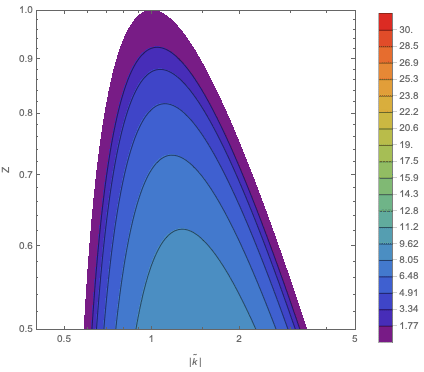
Zooming (PlotRange -> {{0.4, 5}, {.5, 1.0}, {.2, 40}) I obtain

again wrong, since the function is always less than 1 in this domain.
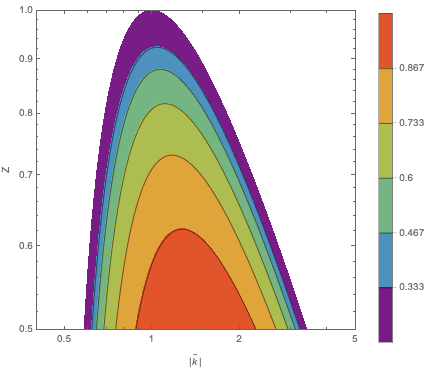
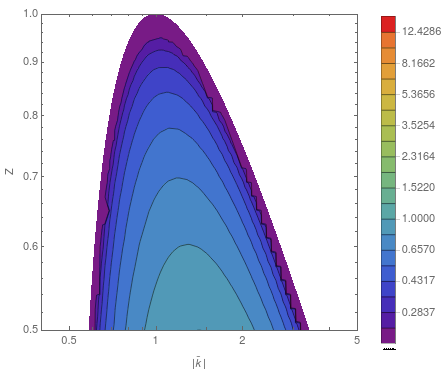
Decreasing the domain of Z, i obtain something more correct (but i need the full range!)
ContourPlot[Sqrt[-1 + (4 k^2)/(1 + k^2 Z)^2], {k, 0.4, 2500}, {Z, 0.5, 1.0}, ClippingStyle -> Automatic, ScalingFunctions -> {"Log", "Log", "Log"}, PlotLegends -> BarLegend[Automatic, All, LabelingFunction -> (Style[NumberForm[#, 3]] &)], PlotPoints -> 20,MaxRecursion -> 4, ColorFunction -> "Rainbow", ContourLabels -> False, Contours -> 20, FrameLabel -> {"|\!\(\*OverscriptBox[\(k\), \(~\)]\)|", "Z"}, PlotRange -> {{0.4, 5}, {.5, 1.0}, {.2, 40}}, ImageSize -> Medium]
I tried increasing/decreasing the PlotPoints, MaxRecursion, WorkinPrecision and others but I really can't get the clue of the problem!
Can someone solve my problem?
Thank you!


PlotLegends -> AutomaticI get a much different legend. $\endgroup$