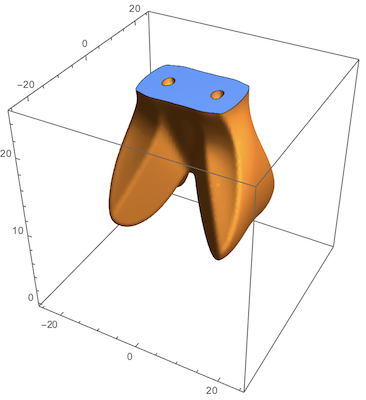
I received a very nice solution by Chip Hurst to make my 3DContourPlots smooth and closed in here. Now I have another problem that is simpler but I still want to know the ideas of the others. The data that I am working with is provided in here. I want to create 3DContourPlots out of this data and then close the plot from the top.
So First I read the data and make an interpolation function out of it
    η2Data = Import["DataEta2.csv"];
funη2 = Interpolation[η2Data];
Then, using the following command, I make a 3D contourplot out of it
p11 = ContourPlot3D[
  funη2[Abs[x], Abs[y], z] == 0.52, {x, -25, 25}, {y, -25,
   25}, {z, 0, 25}, Mesh -> False, ContourStyle -> Blue,
  BoundaryStyle -> None, PlotTheme -> "SmoothShading"]
Now the question is how to close it from the top surface. I was thinking that maybe adding another layer of data with zero values will do the job but I think there should be more elegant and better solutions.


"SmoothShading"is only a theme for mesh based regions. $\endgroup$