So as of now I am using
Ticks -> {Range[0, d, 1]}
where d is the maximum value for my axes.
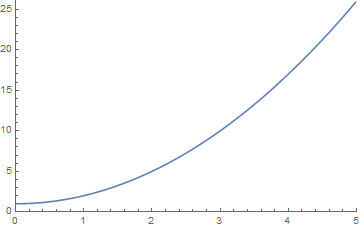
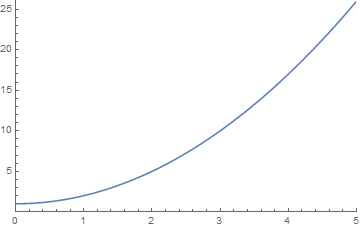
But the thing is that between 0 and 1 (or other integers) there are no minor ticks. Look here.
I have now only the integers and empty space in between. All I want is to have like five minor ticks. Just so that it looks better. I want to have the major (labeled) ticks only at the integers.
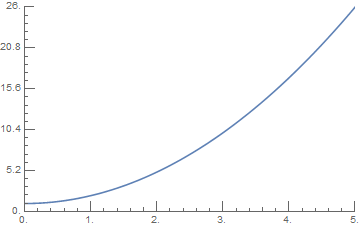
Also could maybe someone tell me how to not have two 0 labels on one plot (one for the x-axis, one for the y-axis)? Again look here.
I've spent an hour looking for the solution, but wasn't able to find a good one.


