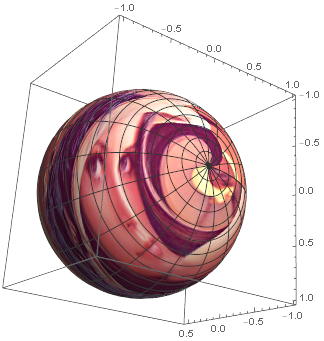
I would like to texture and deform a sphere with with images using various mapping functions between x,y and phi,theta. I figure I should start with $f(phi,theta)=(x,y)$ as a test case. However, I have run into a problem.
When I run:
lena = ExampleData[{"TestImage", "Lena"}];
SphericalPlot3D[1, {ϕ, 1, π}, {θ, 0, 2 Pi},
  ColorFunction -> Function[{x, y, z, ϕ, θ, r}, RGBColor[ImageValue[lena, {ϕ, θ}]]]
]
I receive a number of error messages most notably:
ImageValue::imgrng: The specified argument
{(1. -Graphics`SphericalPlot3DDump`slotfourmin)/(Graphics`SphericalPlot3DDump`slotfourmax-Graphics`SphericalPlot3DDump`slotfourmin),
(4.48799*10^-7-Graphics`SphericalPlot3DDump`slotfivemin)/(Graphics`SphericalPlot3DDump`slotfivemax-Graphics`SphericalPlot3DDump`slotfivemin)}
should be an image, a graphics object, or a list of coordinates.
It seems like SphericalPlot3D is trying to get a range on the color values my color function generates and for some reason it does this with the symbols like Graphics`SphericalPlot3DDump`slotfivemin instead of numerical values.
I can try to get around this like so:
cf[x_, y_, z_, ϕ_NumericQ, θ_NumericQ, r_] :=RGBColor[ImageValue[lena, {ϕ *10, θ *10}]]

SphericalPlot3D[1, {ϕ, 0, π}, {θ, 0, 2 Pi}, ColorFunction -> cf]
But that just produces an ordinary sphere with some weird triangular artifacts.
This maybe an XY problem, and I would be interested in other solutions to this color mapping and deforming problem, maybe using PlotStyle->Texture["imag"]


Plot3D[Max[ImageValue[lena, {x, y}]], {x, 0, 500}, {y, 0, 500}, ColorFunction -> Function[{x, y, z}, RGBColor[ImageValue[lena, {x*500, y*500}]]], PlotRange -> All, PlotPoints -> 120, Mesh -> None]$\endgroup$SphericalPlot3D[1, {\[Phi], 1, \[Pi]}, {\[Theta], 0, 2 Pi}, PlotStyle -> Texture[lena]]$\endgroup$