0
$\begingroup$

I am having a difficult time making my Manipulate show what I want in the CDF player.

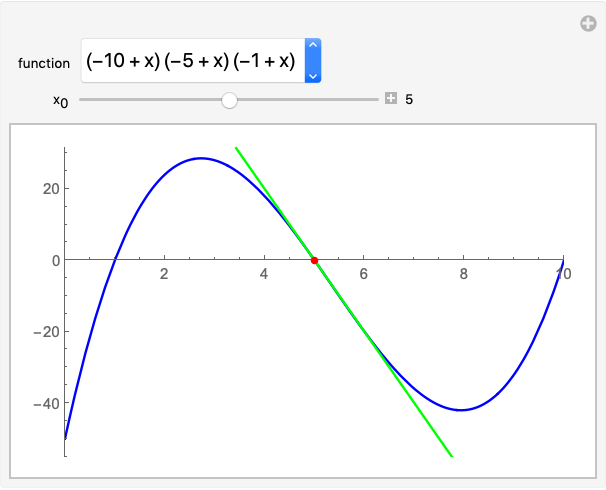
I want to show a tangent sliding along any curve

f[x_] := (x - 1) (x - 5) (x - 10);
tangent[f_, x0_, x_] := f'[x0] (x - x0) + f[x0];
Manipulate[
  Plot[{f[x], tangent[f, p, x]}, {x, 0, 10}, 
    PlotRange -> {{0, 10} {0, 40}}, PlotStyle -> {Blue, Green}, 
    Epilog -> {Red, PointSize[.015], Point @ {p, f[p]}}], 
  {p, 0, 10}]
$\endgroup$
3
  • $\begingroup$ duplicates: sliding a tangent line along a curve and Manipulate Slope? $\endgroup$
    – kglr
    Commented Dec 30, 2018 at 15:08
  • $\begingroup$ My problem is that i dont know why the CDF isn't showing it :c $\endgroup$ Commented Dec 30, 2018 at 15:52
  • $\begingroup$ Works fine for me, once you include the mandatory semicolons separating lines of code. $\endgroup$ Commented Dec 30, 2018 at 19:58

1 Answer 1

0
$\begingroup$

Put everything inside the Manipulate

Manipulate[
 Module[
  {f, xmin = 0, xmax = 10},
  f := func;
  fmin = MinValue[{f[x], xmin <= x <= xmax}, x];
  fmax = MaxValue[{f[x], xmin <= x <= xmax}, x];
  tangent[f_, x0_, x_] := f'[x0] (x - x0) + f[x0];
  Plot[{f[x], tangent[f, p, x]}, {x, xmin, xmax}, 
   PlotRange -> {{xmin, xmax},
     {(1 - 0.1 Sign[fmin]) fmin, (1 + 0.1 Sign[fmax]) fmax}},
   PlotStyle -> {Blue, Green},
   Epilog -> {Red, PointSize[.015], Point@{p, f[p]}}]],
 {{func, f1, "function"}, {f1 -> f1[x], f2 -> f2[x], f3 -> f3[x]}, 
  ControlType -> PopupMenu},
 {{p, 5, Subscript["x", 0]}, 0, 10, Appearance -> "Labeled"},
 Initialization :> {
   f1 := (# - 1) (# - 5) (# - 10) &;
   f2 := Sin[#] + Cos[#] &;
   f3 := #^2*Exp[-#^2/10] &}]

enter image description here

$\endgroup$

Not the answer you're looking for? Browse other questions tagged or ask your own question.