0
$\begingroup$

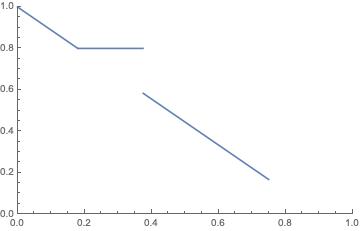
I am having troubles with finding points from a plot. I have a piecewise linear function given by following inequalities. These inequalities I got from previous calculations where I split two functions together and I found their maximum.

{{{0, x > 3/4 || x < 0}, {4/5, 9/50 <= x <= 3/8}, {1/9 (9 - 10 x), 0 <= x <= 3/4}}, 2/9 (-3 + 5 x)}

function

The problem now is that these inequalities are not equal to my plot because I took the maximum of these lines and in this case I am able to find the break points of this plot (x coordinates) but I cant find the y coordinates of them.

Is there any idea how to find these equations to be equal to my plot or how to represent this plot with pairs of points representing the piecewise linear parts?

Any suggestions would be greatly appreciated.

$\endgroup$
1
  • $\begingroup$ Sorry, but it's not clear what you're asking. First, what is the $2/9(-3+5x)$ that you posted? I thought maybe it was the "otherwise" part of your Piecewise but that doesn't seem to be the case as the first part of your Piecewise covers almost all numbers. Do you just want the y-coordinates of the top and bottom part of the 2nd sloping blue line? $\endgroup$
    – MassDefect
    Commented Dec 5, 2018 at 20:24

2 Answers 2

0
$\begingroup$

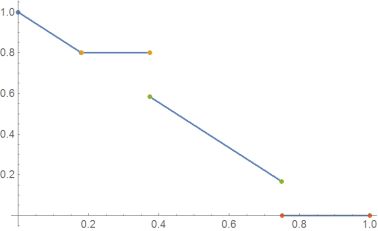
First I try to rebuild the plot

bild = Plot[Piecewise[ {{0, x > 3/4 || x < 0}, {4/5,9/50 <= x <= 3/8}, {1/9 (9 - 10 x), 0 <= x <= 3/4}},2/9 (-3 + 5 x)], {x, 0, 1}]

In bild I search the Line- elements

lines = Cases[bild , _Line , Infinity] /. Line -> Identity

which gives the list of lines(points). First and last element of these lists are the points you're looking for:

points = Map[{First[#], Last[#]} &, lines] // Round[#, .001] &
(*{{{0., 1.}, {0.18, 0.8}}, {{0.18, 0.8}, {0.375, 0.8}},
{{0.375,0.583}, {0.75, 0.167}}, {{0.75, 0.}, {1., 0.}}}*)

Show[bild, ListPlot[points]]

enter image description here

Hope this is the answer you're looking for.

$\endgroup$
3
  • $\begingroup$ Thank you for your answer, this is what I was looking for. I have just one more question. Is it possible $\endgroup$
    – Nikol Š
    Commented Dec 6, 2018 at 12:54
  • $\begingroup$ Thank you for your answer, this is what I was looking for. I have just one more question. Is it possible instead of inequalities in Piecewise in bild to call these inequalities from my saved set lines2= lines /. Piecewise -> List, which returns me the same {{{0, x > 3/4 || x < 0}, {4/5, 9/50 <= x <= 3/8}, {1/9 (9 - 10 x), 0 <= x <= 3/4}}, 2/9 (-3 + 5 x)}? Thank you $\endgroup$
    – Nikol Š
    Commented Dec 6, 2018 at 13:04
  • $\begingroup$ No I don't think so. In bild you'll only find informations concerning the plot-object. $\endgroup$ Commented Dec 6, 2018 at 13:46
1
$\begingroup$
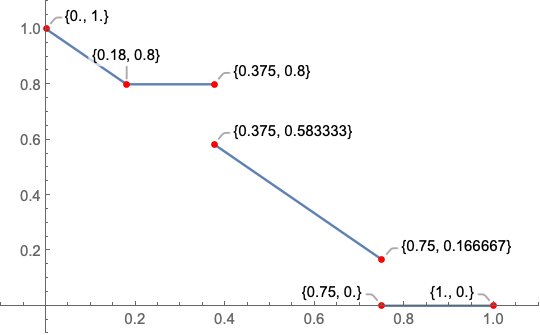
Clear[f]

f[x_] := Piecewise[{{0, x > 3/4 || x < 0}, {4/5, 
     9/50 <= x <= 3/8}, {1/9 (9 - 10 x), 0 <= x <= 3/4}}, 
   2/9 (-3 + 5 x)];

Show[
 Plot[f[x], {x, 0, 1}],
 ListPlot[
  Callout[{#, f[#]} // N] & /@ {0, 9/50, 3/8, 3/8 + 10^-10, 3/4, 
    3/4 + 10^-10, 1},
  PlotStyle -> Directive[Red, PointSize[Medium]]],
 PlotRangePadding -> 0.1]

enter image description here

EDIT: You can also use Limit

Limit[f[x], x -> 3/8, Direction -> #] & /@ {"FromBelow", "FromAbove"}

(* {4/5, 7/12} *)

% // N

(* {0.8, 0.583333} *)

Limit[f[x], x -> 3/4, Direction -> #] & /@ {"FromBelow", "FromAbove"}

(* {1/6, 0} *)

% // N

(* {0.166667, 0.} *)
$\endgroup$

Your Answer

By clicking “Post Your Answer”, you agree to our terms of service and acknowledge you have read our privacy policy.

Not the answer you're looking for? Browse other questions tagged or ask your own question.