3
$\begingroup$

If it is a duplicate, I apologize.

I have the function

g[θ_, P_, Q_] := 
 Pi/180 (Sin[θ/2]^(2 P - 1) Cos[θ/2]^(2 Q - 1))/
  NIntegrate[
   Sin[θp/2]^(2 P - 1) Cos[θp/2]^(2 Q - 1), {θp, 
    0, Pi}]

with

Table[g[θ, i, i], {i, 1, 10}];
Plot[%, {θ, 0, π}, Frame -> True, ImageSize -> 500, 
 FrameTicks -> {{{0, 0.005, 0.01, 0.015, 0.02, 0.025, 0.03, 0.035}, 
    None}, {{0, Pi/2, Pi}, None}}, 
 PlotLegends -> 
  Placed[LineLegend[{"P=1,Q=1", "P=2,Q=2", "P=3,Q=3", "P=4,Q=4", 
     "P=5,Q=5", "P=6,Q=6", "P=7,Q=7", "P=8,Q=8", "P=9,Q=9", 
     "P=10,Q=10"}, LegendLayout -> {"Column", 2}], {0.78, 0.78}], 
 FrameLabel -> {Style["θ", 18], Style["g(θ)", 18]}, 
 FrameStyle -> 15, PlotRange -> All]

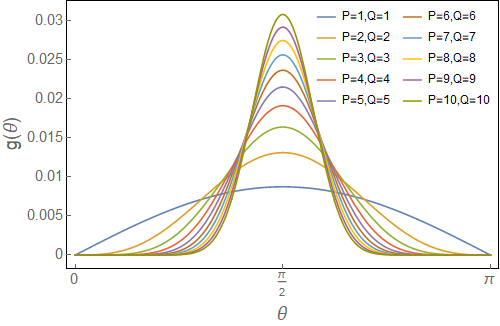
I get the following plot

enter image description here

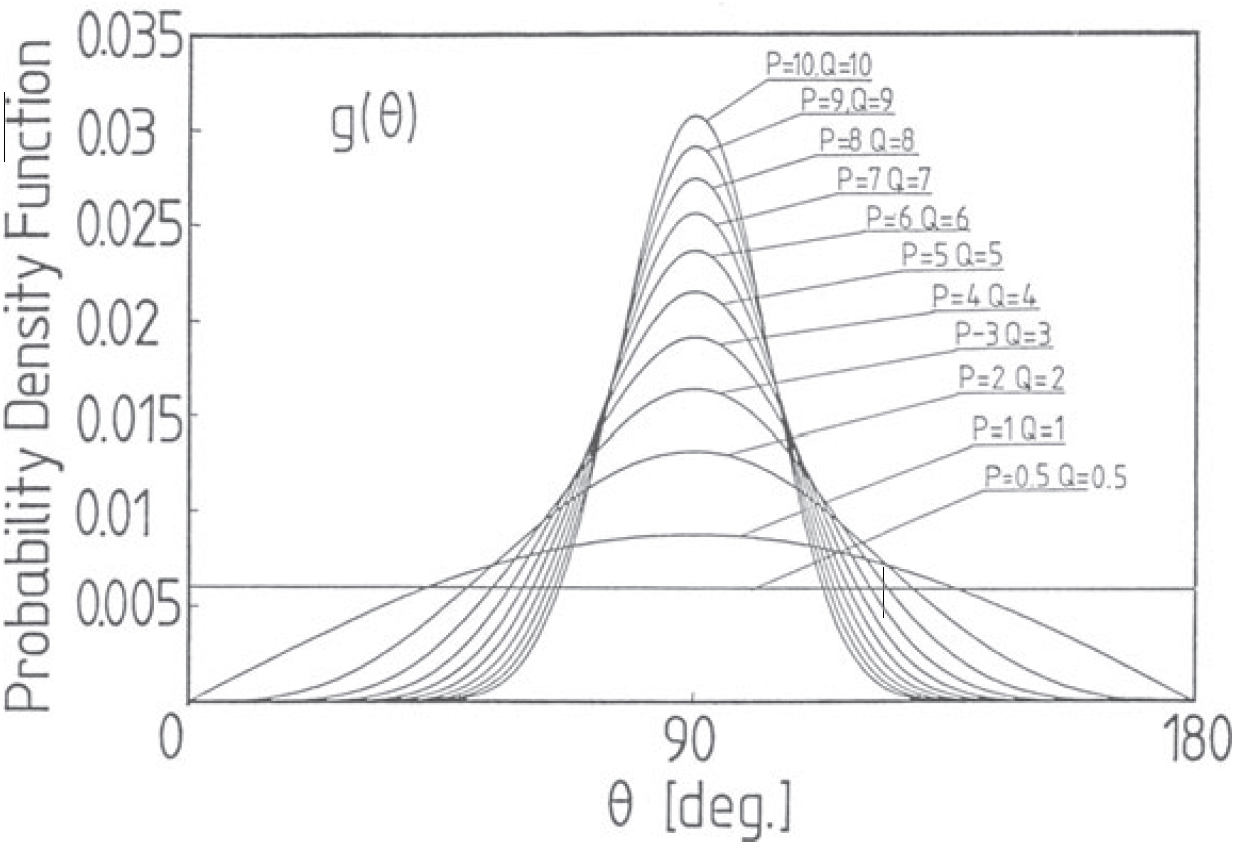
My colleagues prefer something like the following graph:

enter image description here

I guess it is possible to Mathematica. But I do not know how. Thanks in advance for any help regarding these matching lines between legend and corresponding curve.

$\endgroup$
2
  • $\begingroup$ Take a look at Callout[] $\endgroup$
    – Chris
    Commented Nov 28, 2018 at 21:19
  • $\begingroup$ @Chris Wow! Thanks! It is a new function (v. 11). I didn't know about it. $\endgroup$
    – Dimitris
    Commented Nov 28, 2018 at 21:28

2 Answers 2

4
$\begingroup$

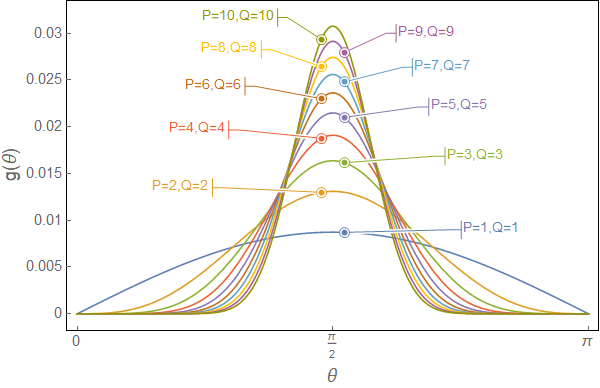
Playing with Callout parameters and options:

labels = {"P=1,Q=1", "P=2,Q=2", "P=3,Q=3", "P=4,Q=4", "P=5,Q=5", 
   "P=6,Q=6", "P=7,Q=7", "P=8,Q=8", "P=9,Q=9", "P=10,Q=10"};
functions = Table[Callout[g[θ, i, i], Style[labels[[i]], 14, ColorData[97][i]],
     π/2 + (-1)^(i + 1) (0.7 - i .05), {#, g[#, i, i]} &@(π/2 + (-1)^(i + 1) 0.07),  
    Appearance -> "Line", CalloutStyle -> ColorData[97][i], 
    CalloutMarker -> "CirclePoint"], {i, 1, 10}];

Plot[Evaluate@functions, {θ, 0, π}, Frame -> True, ImageSize -> 600, 
 FrameTicks -> {{Range[0, .035, .005], None}, {{0, Pi/2, Pi}, None}}, 
 FrameLabel -> {Style["θ", 18], Style["g(θ)", 18]}, FrameStyle -> 15, PlotRange -> All]

enter image description here

$\endgroup$
4
$\begingroup$
Plot[Evaluate@Table[Callout[g[\[Theta], i, i], 
"P = "  <> ToString[i] <> ", Q = " <> ToString[i], \[Pi]/2 + 
 0.4, \[Pi]/2 ], {i, 1, 10}], {\[Theta], 0, \[Pi]}, Frame -> True, ImageSize -> 500,FrameTicks -> {{{0, 0.005, 0.01, 0.015, 0.02, 0.025, 0.03, 0.035}, None}, {{0, Pi/2, Pi}, None}}, FrameLabel -> {Style["\[Theta]", 18], Style["g(\[Theta])", 18]},FrameStyle -> 15, PlotRange -> All]

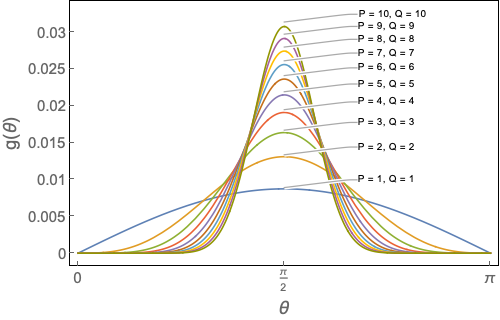
enter image description here

$\endgroup$

Your Answer

By clicking “Post Your Answer”, you agree to our terms of service and acknowledge you have read our privacy policy.

Not the answer you're looking for? Browse other questions tagged or ask your own question.