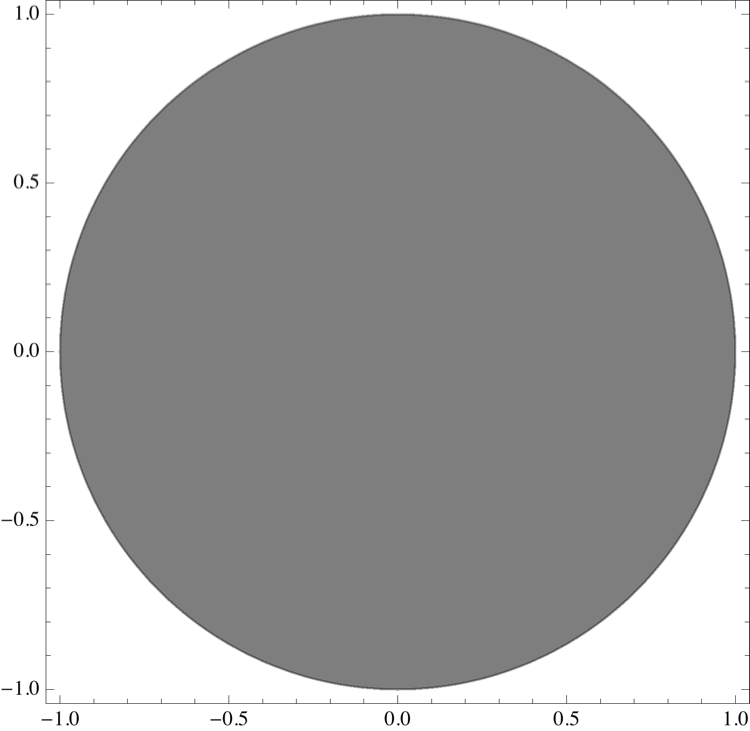
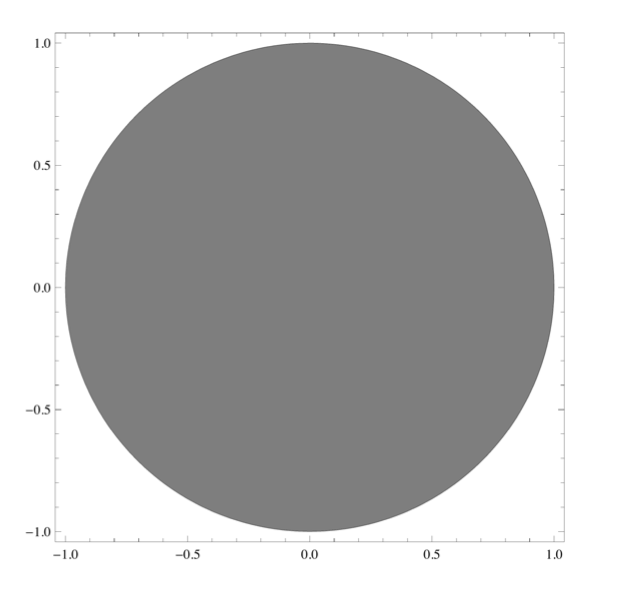
To get nice looking PDF export in this case is not easy. Export is really doing something wrong here. The best option I think would be to do the following:
regionplot =
  RegionPlot[x^2 + y^2 < 1, {x, -1, 1}, {y, -1, 1},
   PlotStyle -> Opacity[0.5, Black]];

Export["region.pdf",
 Show[regionplot,
  Prolog -> {Opacity[0], Texture[{{{0, 0, 0, 0}}}],
    VertexTextureCoordinates -> {{0, 0}, {1, 0}, {1, 1}},
    Polygon[{{0, 0}, {.1, 0}, {.1, .1}}]}]
 ]
Here, I've tricked Mathematica into rasterizing the opaque parts of the plot by using Show to combine the RegionPlot with a single invisible textured polygon that triggers the rasterization upon Export. To insert this trick, I used a Prolog option, but instead you could also use Epilog. If you do this often, it would be convenient to define something like
rasterTrick[plot_] :=
 Show[plot,
  Prolog -> {Opacity[0], Texture[{{{0, 0, 0, 0}}}],
    VertexTextureCoordinates -> {{0, 0}, {1, 0}, {1, 1}},
    Polygon[{{0, 0}, {.1, 0}, {.1, .1}}]}]

Export["region.pdf", regionplot // rasterTrick]

The above is the exported PDF.
This is borrowed from my earlier answer here, except that SetOptions in this case doesn't work properly as a way to make this trick stick with every RegionPlot.


