5
$\begingroup$
s = NDSolve[{
    Derivative[1][x][t] == -y[t] - z[t],
    Derivative[1][y][t] == x[t] + 0.1 y[t],
    Derivative[1][z][t] == .01 + z[t] (x[t] - 14),
    x[0] == z[0] == 0, y[0] == 0}, {x, y, z}, {t, 0, 400},
    MaxSteps -> Infinity];
Show[ParametricPlot3D[Evaluate[{x[t], y[t], z[t]} /. s], {t, 0, 400},
     PlotPoints -> 2000, PlotStyle -> Directive[Thick, RGBColor[0, 0, 0]],
     ColorFunction -> (ColorData["SolarColors", #1] &)],
     Graphics3D[{ColorData["SolarColors"][0],
                 Sphere[First[({x[t], y[t], z[t]} /. s) /. t -> 0], 1]}],
     RotationAction -> "Clip", Boxed -> False, SphericalRegion -> False, 
     Axes -> False, ImageSize -> 500]

When I do this code it only shows a picture of part of the Rossler attractor, even though the derivatives are correct. What's going wrong?

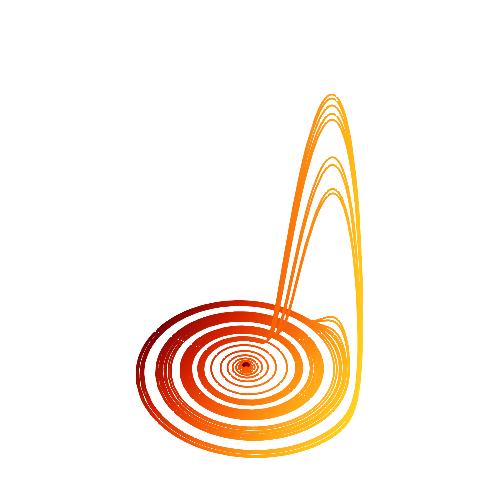
$\endgroup$
6
  • 1
    $\begingroup$ Add the PlotRange -> All option to Graphics3D. $\endgroup$ Commented Nov 17, 2018 at 17:29
  • $\begingroup$ @RohitNamjoshi still not working for me $\endgroup$ Commented Nov 17, 2018 at 17:43
  • 1
    $\begingroup$ That is odd. What version of Mathematica are you running? I am on 11.3.0 for Mac OS X x86 (64-bit) (March 7, 2018). When I add that option I see this. $\endgroup$ Commented Nov 17, 2018 at 17:49
  • $\begingroup$ @RohitNamjoshi It is the latest version. Can you send me the complete code you entered? I may be doing something wrong (I'm new to this). $\endgroup$ Commented Nov 17, 2018 at 17:56
  • $\begingroup$ I copied exactly what you posted and added PlotRange -> All as the last argument to Plot. Perhaps you have some previously bound symbol that is interfering. Try evaluating ClearAll["Global*"]` first. $\endgroup$ Commented Nov 17, 2018 at 18:12

1 Answer 1

11
$\begingroup$

Add PlotRange -> All

Show[ParametricPlot3D[Evaluate[{x[t], y[t], z[t]} /. s], {t, 0, 400}, 
  PlotPoints -> 2000, 
  PlotStyle -> Directive[Thick, RGBColor[0, 0, 0]], 
  ColorFunction -> (ColorData["SolarColors", #1] &)], 
 Graphics3D[{ColorData["SolarColors"][0], 
   Sphere[First[({x[t], y[t], z[t]} /. s) /. t -> 0], 1]}], 
 RotationAction -> "Clip", Boxed -> False, SphericalRegion -> False, 
 Axes -> False, ImageSize -> 500, PlotRange -> All]

enter image description here

$\endgroup$

Not the answer you're looking for? Browse other questions tagged or ask your own question.