0
$\begingroup$

I am trying to use ListLinePlot to plot three "Components" of my TemporalData in Mathematica. The three components differ widely in the range of the data. So, I want to Rescale each component and plot.

I used the Rescale function on each "Components". This works well if there is no missing data in the Component. However, it does not plot if there is missing data. I know there is a RescaleTimeSeries function to scale the time axis. Is there a corresponding function for the y-axis.

@Gladaed, Here is an example with two components:

r = {11, 13, 2, 7, 17, 8};
s = {2, 1, 6, 5, 7, 4};
t = {1, 2, 5, 10, 12, 15};
td = TemporalData[{r, s}, {t}]

rmissing = {11, 13, Missing["No Data"], 7, 17, 8};
tdmissing = TemporalData[{rmissing, s}, {t}]

grp0 = ListLinePlot[td]
grpmissing = ListLinePlot[tdmissing]

grp1 = ListLinePlot[{Rescale[td["Components"][[1]]], Rescale[td["Components"][[2]]]}]
grprescaledandmissing = ListLinePlot[{Rescale[tdmissing["Components"][[1]]], Rescale[tdmissing["Components"][[2]]]}]

You will see that the Rescaled Plot "grprescaledandmissing" does not plot the Component with missing data. The regular ListLinePlot "grpmissing" that is not Rescaled is fine.

$\endgroup$
3
  • 1
    $\begingroup$ Can you provide examples? i would guess that Show might help but that's just a wild guess right now. In general try to provide a minimal working example. A lot of questions are solved while constructing such example and if they are not, they are easier to answer due to the example. $\endgroup$
    – Gladaed
    Commented Nov 16, 2018 at 13:49
  • $\begingroup$ @Gladaed, Here is an example: r = {11, 13, 2, 7, 17, 8}; s = {2, 1, 6, 5, 7, 4}; t = {1, 2, 5, 10, 12, 15}; td = TemporalData[{r, s}, {t}] rmissing = {11, 13, Missing["No Data"], 7, 17, 8}; tdmissing = TemporalData[{rmissing, s}, {t}] grp0 = ListLinePlot[td] grpmissing = ListLinePlot[tdmissing] grp1 = ListLinePlot[{Rescale[td["Components"][[1]]], Rescale[td["Components"][[2]]]}] grpmissing = ListLinePlot[{Rescale[tdmissing["Components"][[1]]], Rescale[tdmissing["Components"][[2]]]}] $\endgroup$
    – Murali
    Commented Nov 16, 2018 at 17:24
  • 1
    $\begingroup$ The reason you're having issues is because Rescale does not know how you'd prefer Missing to be handled so it returns a symbolic output which in turn doesn't plot. Perhaps you should consider using the ResamplingMethod option or handle the missing data manually (hand code it to a numeric value eg 0 if applicable for the use case at hand) $\endgroup$
    – user42582
    Commented Nov 16, 2018 at 21:11

1 Answer 1

1
$\begingroup$

Your issue is caused by the way Mathematica's Plot function handles missing data. It assumes it to be eg. a potentially noisy dataset where interpolating could lead to false assumptions about the dataset.

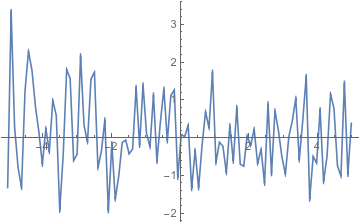
EG: A vibration/motion sensor gives us information about the quality of a measurement. Less variance the better. It measures tries to measure this:

real noise

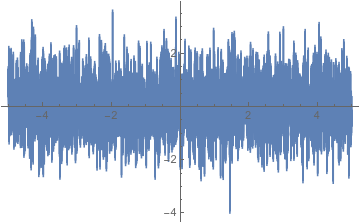
But since it only can measure once every 10th part of a second it gives us:

measured noise

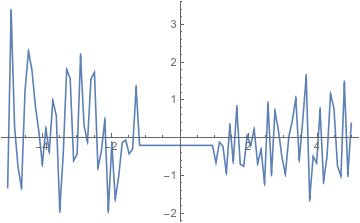
which is good. But now the sensor had a loose connection now it gave temporal data with some Missing[] elements. If it assumed it should interpolate it would give this curve below. While it is a little obvious for this example imagine more smaller sections of missing data. This could do serious damage to you project if you don't know about this behaviour.

loose connection with interpolation

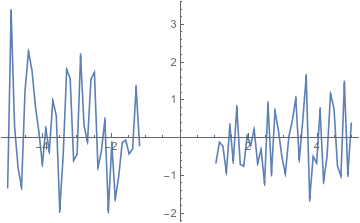
Now you would think that the data is way less noisy than it actually is instead of noting the lack of data like this:

loose connection without interpolation

That's why you have to tell TemporalData via MissingDataMethod what to do in such cases if you want some fixing of missing points. Found using: google search.

Code:

randomList = RandomVariate[NormalDistribution[], 100];
t = Range[-5, 5, 10.0/(100 - 1)];
randomTD = TemporalData[randomList, {t}]
randomList[[40 ;; 60]] = Missing["loose connection"]
randomMissingTD = TemporalData[randomList, {t}]
randomMissingInterpolTD = 
 TemporalData[randomList, {t}, 
  MissingDataMethod -> {"Interpolation"}]
Plot[RandomVariate[NormalDistribution[]], {x, -5, 5}]
ListLinePlot[randomTD]
ListLinePlot[randomMissingTD]
ListLinePlot[randomMissingInterpolTD] 
$\endgroup$
5
  • $\begingroup$ I am still struggling with this issue. It appears the problem is because of the Rescale function I used. I tried the MissingDataMethod->{"Interpolation"} on a small dataset and it works. However, when I tried to use it on a larger TemporalData variable (that was defined in function), it did not. What is the difference between MissingDataMethod and ResamplingMethod? $\endgroup$
    – Murali
    Commented Nov 21, 2018 at 16:08
  • $\begingroup$ @Murali I do not know. I am sorry i did not answer in a while. Can you provide a example that reproduces your issue? E.g. with RandomInteger[2, 10^6] $\endgroup$
    – Gladaed
    Commented Nov 28, 2018 at 14:27
  • $\begingroup$ I resolved the issue. I had to rewrite my version of Rescale, which did not handle Missing[] well. I extracted the rescaling factor from the numeric (non-missing) data and replotted. Thanks for your help. $\endgroup$
    – Murali
    Commented Nov 28, 2018 at 19:08
  • $\begingroup$ @Murali You can Accept answers on SE such that other people know this has been solved well enough and people having similair issues can find the best answer easily. $\endgroup$
    – Gladaed
    Commented Nov 29, 2018 at 11:41
  • $\begingroup$ MissingDataMethod controls what values that are explicitly Missing[] are replaced with - a constant or an interpolated value, etc. ResamplingMethod defines how the values between time stamps are computed (hold the value from the left or use interpolation, etc.) $\endgroup$
    – Gosia
    Commented Jan 2, 2019 at 20:44

Your Answer

By clicking “Post Your Answer”, you agree to our terms of service and acknowledge you have read our privacy policy.

Not the answer you're looking for? Browse other questions tagged or ask your own question.