The code contains several typos, after correcting which the code works. It is difficult to understand what the author wants. I understood that it is necessary to choose a certain number of points from the data (in my example, every fortieth)
eulerStep[{t_, state_List}, h_, f_List] := {t + h,
  state + h Through[f[{t, state}]]}
solveSystemEuler[{t0_, state0_}, h_, n_Integer, f_List] :=
 NestList[eulerStep[#, h, f] &, {t0, state0}, n]
midptStep[{t_, state_List}, h_, f_List] := {t + h,
  state + h Through[
     f[{t + 1/2 h, state + 1/2 h Through[f[{t, state}]]}]]}
solveSytemMidPt[{t0_, state0_}, h_, n_Integer, f_List] :=
 NestList[midptStep[#, h, f] &, {t0, state0}, n]
L = 1/2 (x'[t]^2 + y'[t]^2) +
  1/Sqrt[x[t]^2 + y[t]^2]; eq = {D[D[L, x'[t]], t] - D[L, x[t]] == 0,
  D[D[L, y'[t]], t] - D[L, y[t]] == 0};
xdot[{t_, {x_, vx_, y_, vy_}}] := vx
vxdot[{t_, {x_, vx_, y_, vy_}}] := -x/(x^2 + y^2)^(3/2)
ydot[{t_, {x_, vx_, y_, vy_}}] := vy
vydot[{t_, {x_, vx_, y_, vy_}}] := -y/(x^2 + y^2)^(3/2)
start = {1, 0, 0, 1}; fcns = {xdot, vxdot, ydot, vydot}; orbit =
 solveSystemEuler[{0, start}, 0.01, 800, fcns]; xypts =
 orbit\[Transpose][[2]]\[Transpose][[{1,
    3}]]\[Transpose];
earthorbit = xypts;
spacestart = {1, 0, 0, 1.25};
orbit = solveSytemMidPt[{0, spacestart}, 0.01, 2200,
  fcns]; spaceshiporbit =
 orbit\[Transpose][[2]]\[Transpose][[{1,
    3}]]\[Transpose];
ListLinePlot[{earthorbit, spaceshiporbit},
 PlotStyle -> {Hue[0], Hue[0.66]}, AspectRatio -> Automatic]

{ListPlot[{Table[earthorbit[[n]], {n, 1, Length[earthorbit], 40}],
   Table[spaceshiporbit[[n]], {n, 1, Length[spaceshiporbit], 40}]},
  PlotStyle -> {Hue[0], Hue[0.66]},
  PlotRange -> {{-3.6, 1.2}, {-2, 2}}, AspectRatio -> Automatic],
 ListLinePlot[{Table[earthorbit[[n]], {n, 1, Length[earthorbit], 40}],
    Table[spaceshiporbit[[n]], {n, 1, Length[spaceshiporbit], 40}]},
  PlotStyle -> {Hue[0], Hue[0.66]},
  PlotRange -> {{-3.6, 1.2}, {-2, 2}}, AspectRatio -> Automatic]}

Table[ListLinePlot[{Take[earthorbit, {n, n + 100}],
   Take[spaceshiporbit, {n, n + 100}]},
  PlotStyle -> {Hue[0], Hue[0.66]},
  PlotRange -> {{-3.6, 1.2}, {-2, 2}}, AspectRatio -> Automatic], {n,
  1, Min[Length[earthorbit], Length[spaceshiporbit]] - 100, 100}]
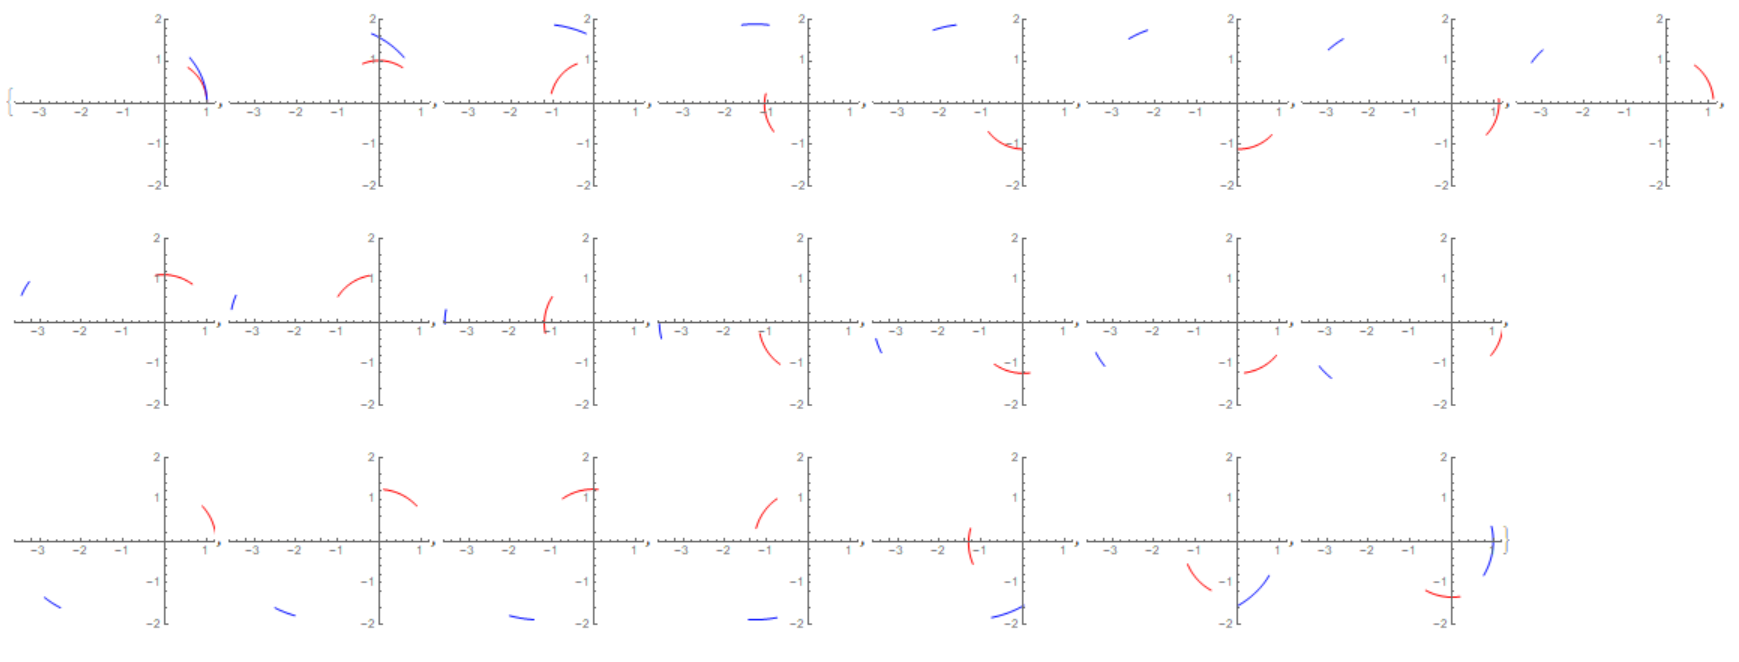
 Align the data by length and create 22 patterns as the author wants.
orbit = solveSystemEuler[{0, start}, 0.01, 2200, fcns]; xypts =
 orbit\[Transpose][[2]]\[Transpose][[{1, 3}]]\[Transpose];
earthorbit = xypts; Table[
 ListLinePlot[{Take[earthorbit, {n, n + 100}],
   Take[spaceshiporbit, {n, n + 100}]},
  PlotStyle -> {Hue[0], Hue[0.66]},
  PlotRange -> {{-3.6, 1.2}, {-2, 2}}, AspectRatio -> Automatic], {n,
  1, Min[Length[earthorbit], Length[spaceshiporbit]] - 100, 100}]

Coordinates and speed depending on time and speed depending on coordinate
orbit = solveSystemEuler[{0, start}, 0.01, 800, fcns];

{ListPlot[
  Table[{orbit[[i, 1]], orbit[[i, 2]][[1]]}, {i, 1, Length[orbit]}],
  AxesLabel -> {"t", "x"}],
 ListPlot[Table[{orbit[[i, 1]], orbit[[i, 2]][[2]]}, {i, 1,
    Length[orbit]}], AxesLabel -> {"t", "Vx"}],
 ListPlot[
  Table[{orbit[[i, 2]][[1]], orbit[[i, 2]][[2]]}, {i, 1,
    Length[orbit]}], AxesLabel -> {"x", "Vx"}]}

Interpolation of sample data
vyvsy = Interpolation[
   Transpose[{Take[orbit[[All, 2]][[All, 3]], 1100],
     Take[orbit[[All, 2]][[All, 4]], 1100]}]];

vxvsx = Interpolation[
   Transpose[{Take[orbit[[All, 2]][[All, 1]], {550, 1650}],
     Take[orbit[[All, 2]][[All, 2]], {550, 1650}]}]];

vxvst = Interpolation[
   Transpose[{Take[orbit[[All, 2]][[All, 1]], -1100],
     Take[orbit[[All, 2]][[All, 2]], -1100]}]];
Dependencies of parameters in various combinations
orbit =
 solveSystemEuler[{0, start}, 0.01, 800, fcns];
{ListPlot[Transpose[{orbit[[All, 1]], orbit[[All, 2]][[All, 1]]}],
  AxesLabel -> {"t", "x"}],

 ListPlot[Transpose[{orbit[[All, 1]], orbit[[All, 2]][[All, 2]]}],
  AxesLabel -> {"t", "Vx"}],

 ListPlot[Transpose[{orbit[[All, 1]], orbit[[All, 2]][[All, 3]]}],
  AxesLabel -> {"t", "y"}],

 ListPlot[Transpose[{orbit[[All, 1]], orbit[[All, 2]][[All, 4]]}],
  AxesLabel -> {"t", "Vy"}]}
{ListPlot[
  Transpose[{orbit[[All, 2]][[All, 1]], orbit[[All, 2]][[All, 2]]}],
  AxesLabel -> {"x", "Vx"}],

 ListPlot[
  Transpose[{orbit[[All, 2]][[All, 3]], orbit[[All, 2]][[All, 4]]}],
  AxesLabel -> {"y", "Vy"}],
 ListPlot[Transpose[{orbit[[All, 2]][[All, 1]],
    orbit[[All, 2]][[All, 3]]}], AxesLabel -> {"x", "y"}],
 ListPlot[Transpose[{orbit[[All, 2]][[All, 2]],
    orbit[[All, 2]][[All, 4]]}], AxesLabel -> {"Vx", "Vy"}]}
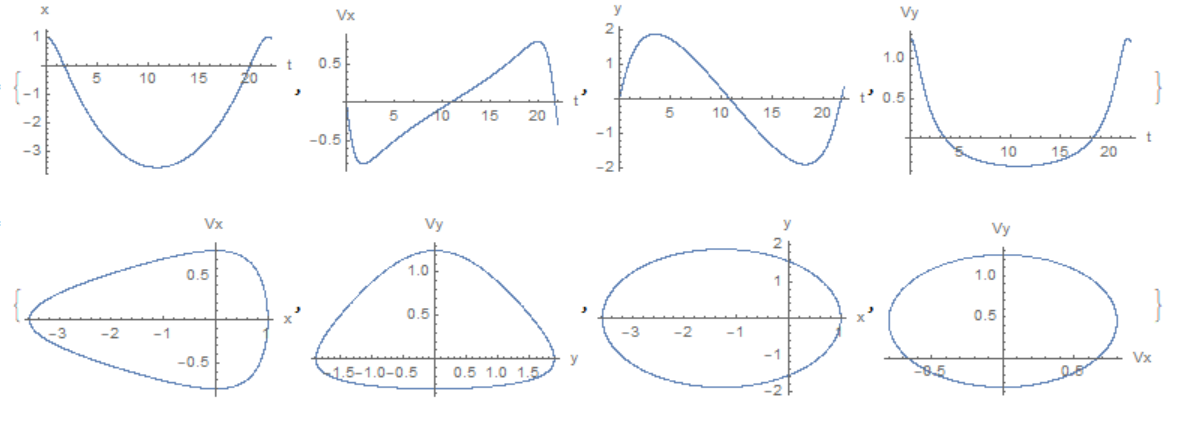
 Another portion of the drawings. I repeat all the code so that there are no errors.
eulerStep[{t_, state_List}, h_, f_List] := {t + h,
  state + h Through[f[{t, state}]]}
solveSystemEuler[{t0_, state0_}, h_, n_Integer, f_List] :=
 NestList[eulerStep[#, h, f] &, {t0, state0}, n]
midptStep[{t_, state_List}, h_, f_List] := {t + h,
  state + h Through[
     f[{t + 1/2 h, state + 1/2 h Through[f[{t, state}]]}]]}
solveSytemMidPt[{t0_, state0_}, h_, n_Integer, f_List] :=
 NestList[midptStep[#, h, f] &, {t0, state0}, n]
L = 1/2 (x'[t]^2 + y'[t]^2) +
  1/Sqrt[x[t]^2 + y[t]^2]; eq = {D[D[L, x'[t]], t] - D[L, x[t]] == 0,
  D[D[L, y'[t]], t] - D[L, y[t]] == 0};
xdot[{t_, {x_, vx_, y_, vy_}}] := vx
vxdot[{t_, {x_, vx_, y_, vy_}}] := -x/(x^2 + y^2)^(3/2)
ydot[{t_, {x_, vx_, y_, vy_}}] := vy
vydot[{t_, {x_, vx_, y_, vy_}}] := -y/(x^2 + y^2)^(3/2)
fcns = {xdot, vxdot, ydot, vydot};


spacestart = {1, 0, 0, 1.25};
orbit = solveSytemMidPt[{0, spacestart}, 0.01, 2200, fcns];


{ListPlot[Transpose[{orbit[[All, 1]], orbit[[All, 2]][[All, 1]]}],
  AxesLabel -> {"t", "x"}],

 ListPlot[Transpose[{orbit[[All, 1]], orbit[[All, 2]][[All, 2]]}],
  AxesLabel -> {"t", "Vx"}],

 ListPlot[Transpose[{orbit[[All, 1]], orbit[[All, 2]][[All, 3]]}],
  AxesLabel -> {"t", "y"}],

 ListPlot[Transpose[{orbit[[All, 1]], orbit[[All, 2]][[All, 4]]}],
  AxesLabel -> {"t", "Vy"}]}


{ListPlot[
  Transpose[{orbit[[All, 2]][[All, 1]], orbit[[All, 2]][[All, 2]]}],
  AxesLabel -> {"x", "Vx"}],

 ListPlot[
  Transpose[{orbit[[All, 2]][[All, 3]], orbit[[All, 2]][[All, 4]]}],
  AxesLabel -> {"y", "Vy"}],
 ListPlot[Transpose[{orbit[[All, 2]][[All, 1]],
    orbit[[All, 2]][[All, 3]]}], AxesLabel -> {"x", "y"}],
 ListPlot[Transpose[{orbit[[All, 2]][[All, 2]],
    orbit[[All, 2]][[All, 4]]}], AxesLabel -> {"Vx", "Vy"}]}


