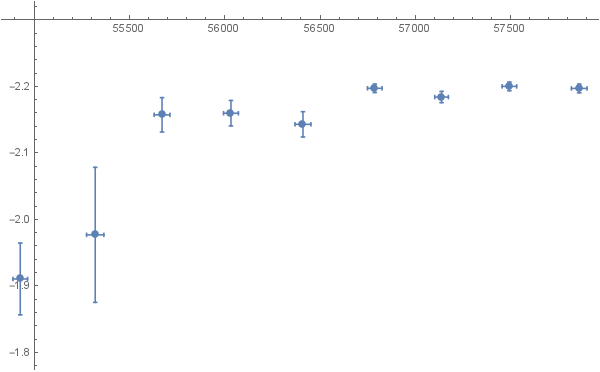
I have data which I would like to plot along with the corresponding error bars:
{{{54927.7, -1.91044},
ErrorBar[38.2664, 0.0538982]}, {{55320.9, -1.97673},
ErrorBar[45.3592, 0.101486]}, {{55671.4, -2.15716},
ErrorBar[41.2234, 0.0258249]}, {{56032.9, -2.15957},
ErrorBar[38.8805, 0.0191277]}, {{56410.6, -2.14289},
ErrorBar[41.5501, 0.0189911]}, {{56787.2, -2.19703},
ErrorBar[38.1972, 0.00632055]}, {{57137.5, -2.1839},
ErrorBar[35.6098, 0.0084108]}, {{57493.3, -2.19994},
ErrorBar[38.0298, 0.00651633]}, {{57859.5, -2.19687},
ErrorBar[40.9682, 0.00658857]}}
I can use the ErrorListPlot function in mathematica just fine, however if I would like to reverse the y axis scale with the function ScalingFunctions->"Reverse" the error bars do not get plotted along with the data.....any suggestions on how to fix this?

