1
$\begingroup$

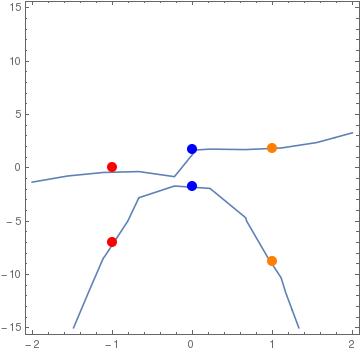
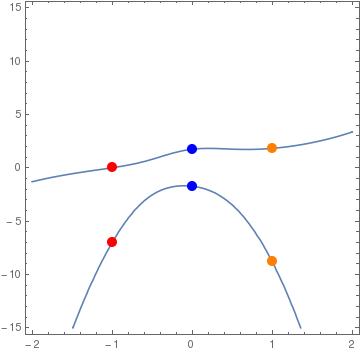
I want to create a slider for the $k$ constant in the function $h(u)$ on the second line. The code outputs a graph that seems to be using too few points. The two pictures below use the same $k$-value, one with the "Manipulate"-function and the other without.

Manipulate[
     h[u_] = k*u^2;
     fun[u_, v_] = -v^2 + u^5 + u^4 + 4 u^3 + 4 u^2 + 3 u + 3 - h[u]*v ;

     P1 = {-1, y /. (Solve[fun[-1, y] == 0, y])[[1]]};
     P1spec = { P1[[1]], -P1[[2]] - h[P1[[1]]]};
     P2 = {0, y /. (Solve[fun[0, y] == 0, y])[[1]]};
     P2spec = { P2[[1]], -P2[[2]] - h[P2[[1]]]};
     P3 = {1, y /. (Solve[fun[1, y] == 0, y])[[1]]};
     P3spec = { P3[[1]], -P3[[2]] - h[P3[[1]]]};


     ContourPlot[fun[x, y] == 0, {x, -2, 2}, {y, -15, 15}, 
      Epilog -> {PointSize[0.03],
        Red, Tooltip[#, #[[1]]] &@Point[P1], 
        Tooltip[#, #[[1]]] &@Point[P1spec],
        Blue, Tooltip[#, #[[1]]] &@Point[P2], 
        Tooltip[#, #[[1]]] &@Point[P2spec],
        Orange, Tooltip[#, #[[1]]] &@Point[P3], 
        Tooltip[#, #[[1]]] &@Point[P3spec]}],
     {k, -2, 7}
]

Output with manipulate

Output without manipulate

$\endgroup$
6
  • $\begingroup$ This seems to work as is should in my copy of version 11.3 for macOS. The first picture looks like what I get when I move the slider and do not release it. Per default, Mathematica tries to increase responsiveness by computing in low quality during dynamic changes. But I don't know what went wrong in your case. Usually, releasing the mouse button leads to a high-definition render after a second or so. $\endgroup$ Commented Aug 23, 2018 at 9:54
  • $\begingroup$ @HenrikSchumacher, it doesn't change after releasing the mouse button. I'm using version 11.1.1 on Linux. Do you by any chance have an idea what the issue could be? Regardless, thanks for your help! $\endgroup$ Commented Aug 23, 2018 at 10:01
  • $\begingroup$ you can try using the option PerformanceGoal -> "Quality" in ContourPlot (the responsiveness tp slider movements will be slower) $\endgroup$
    – kglr
    Commented Aug 23, 2018 at 10:01
  • $\begingroup$ @kglr, thank you, but unfortunately the exact same behavior. $\endgroup$ Commented Aug 23, 2018 at 10:03
  • $\begingroup$ Try to add the option PlotPoints -> 50 to your plot statement. It may improve the quality of the plot. Play with the number of points. $\endgroup$ Commented Aug 23, 2018 at 11:01

1 Answer 1

1
$\begingroup$

Try to add the option PlotPoints -> 50 to your plot statement as follows:

Manipulate[h[u_] = k*u^2;
 fun[u_, v_] = -v^2 + u^5 + u^4 + 4 u^3 + 4 u^2 + 3 u + 3 - h[u]*v;
 P1 = {-1, y /. (Solve[fun[-1, y] == 0, y])[[1]]};
 P1spec = {P1[[1]], -P1[[2]] - h[P1[[1]]]};
 P2 = {0, y /. (Solve[fun[0, y] == 0, y])[[1]]};
 P2spec = {P2[[1]], -P2[[2]] - h[P2[[1]]]};
 P3 = {1, y /. (Solve[fun[1, y] == 0, y])[[1]]};
 P3spec = {P3[[1]], -P3[[2]] - h[P3[[1]]]};
 ContourPlot[fun[x, y] == 0, {x, -2, 2}, {y, -15, 15}, 

  PlotPoints -> 50, 

  Epilog -> {PointSize[0.03], Red, Tooltip[#, #[[1]]] &@Point[P1], 
    Tooltip[#, #[[1]]] &@Point[P1spec], Blue, 
    Tooltip[#, #[[1]]] &@Point[P2], 
    Tooltip[#, #[[1]]] &@Point[P2spec], Orange, 
    Tooltip[#, #[[1]]] &@Point[P3], 
    Tooltip[#, #[[1]]] &@Point[P3spec]}], {k, -2, 7}]

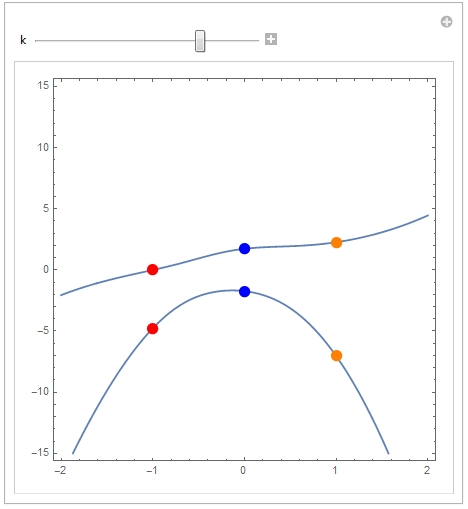
I separated it out by empty lines just to make it visible in the code. It may improve the quality of the plot. Play with the number of points. The result should look as follows:

enter image description here

Have fun!

$\endgroup$

Your Answer

By clicking “Post Your Answer”, you agree to our terms of service and acknowledge you have read our privacy policy.

Not the answer you're looking for? Browse other questions tagged or ask your own question.