1
$\begingroup$

I have a PDE system, whose functions are $a=a(t, x, y)$, $b=b(t,x,y)$, and $c=c(t,x,y)$,

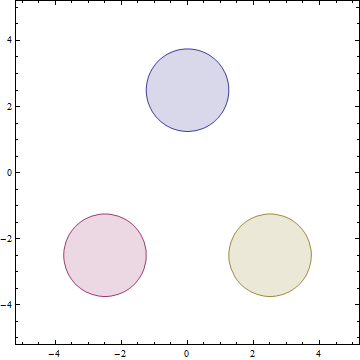
enter image description here

with Dirichlet null boundary conditions and initial conditions in the form of circle.

enter image description here

The respective code is,

 L = 5;(*length of square*)
pts = 150;
T = 250;(*Time integration*)
Df = 1;
σ = 0.6;
µ = 0.3;
(*system of nonlinear PDE*)
pde = {D[a[t, x, y], t] == 
    Df (D[a[t, x, y], x, x] + D[a[t, x, y], y, y]) + µ (1 - 
        a[t, x, y] - b[t, x, y] - c[t, x, y]) a[t, x, y] - σ c[
       t, x, y] a[t, x, y], 
   D[b[t, x, y], t] == 
    Df (D[b[t, x, y], x, x] + D[b[t, x, y], y, y]) + µ (1 - 
        a[t, x, y] - b[t, x, y] - c[t, x, y]) b[t, x, y] - σ a[
       t, x, y] b[t, x, y], 
   D[c[t, x, y], t] == 
    Df (D[c[t, x, y], x, x] + D[c[t, x, y], y, y]) + µ (1 - 
        a[t, x, y] - b[t, x, y] - c[t, x, y]) c[t, x, y] - σ c[
       t, x, y] b[t, x, y]};
(*Dirichlet boundary condition*)
bc = {a[t, -L, y] == 0, a[t, L, y] == 0, a[t, x, -L] == 0, 
   a[t, x, L] == 0, b[t, -L, y] == 0, b[t, L, y] == 0, 
   b[t, x, -L] == 0, b[t, x, L] == 0, c[t, -L, y] == 0, 
   c[t, L, y] == 0, c[t, x, -L] == 0, c[t, x, L] == 0};
(*initial condition*)
ic = {a[0, x, y] == If[(x)^2 + (y - 2.5)^2 <= (L/4)^2, 1, 0], 
   b[0, x, y] == If[(x + 2.5)^2 + (y + 2.5)^2 <= (L/4)^2, 1, 0], 
   c[0, x, y] == If[(x - 2.5)^2 + (y + 2.5)^2 <= (L/4)^2, 1, 0]};
eqns = Flatten@{pde, bc, ic};
sol = NDSolve[eqns, {a, b, c}, {t, 0, T}, {x, -L, L}, {y, -L, L}, 
   Method -> {"MethodOfLines", 
     "SpatialDiscretization" -> {"TensorProductGrid", 
       "MinPoints" -> pts, "MaxPoints" -> pts}}];

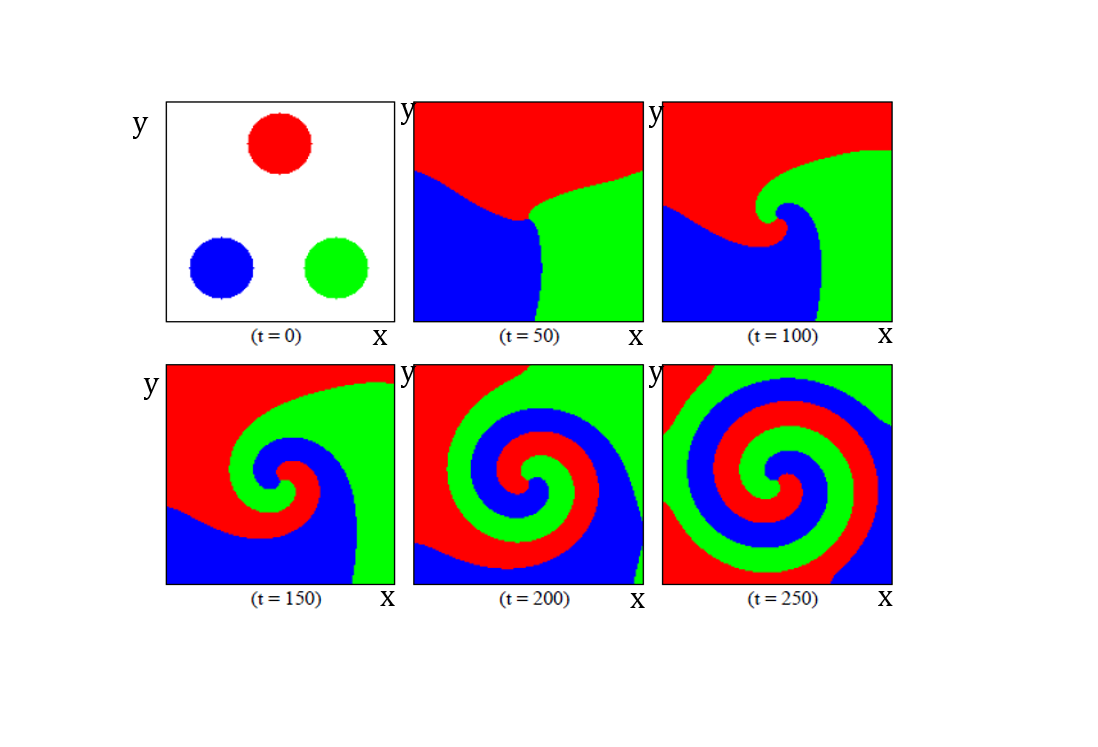
I would like to plot $6$ frames ($y \times x$) using DensityPlot (or ListDensityPlot) for the times $t=0$, $t=50$, $t=100$, $t=150$, $t=200$, $t=250$. I would like also to represent $a(t, x, y)$ $\rightarrow $ red color, $b(t, x, y)$ $\rightarrow $ blue, and $c(t, x, y)$ $\rightarrow $ green.

At each point $(x, y)$, if $a(t, x, y)$ has the highest value in relation to $b(t, x, y)$ and/or $c(t, x, y)$ to color the respective point with red color. If at some point $(x, y)$, $b(t, x, y)$ has the largest value in relation to $a(t, x, y)$ and $c(t, x, y)$ to color that point with blue. If at any point $(x, y)$, $c(t, x, y)$ has a value greater than $a(t, x, y)$ and/or $b(t, x, y)$, then to color the respective point with green.The figure below shows the expected scheme

enter image description here

can anybody help me?

$\endgroup$
4
  • $\begingroup$ I can see your images and my sol does not appear to give those results. Nevertheless I think you should be able to apply the methods I show in my answer; please try them and report. $\endgroup$
    – Mr.Wizard
    Commented Aug 8, 2018 at 2:44
  • $\begingroup$ @Mr.Wizard perfect! There is only one thing that is not working well, in regions where a, b and c are 0, it is coloring green, it could be white. Do you have any suggestions for this? $\endgroup$
    – SAC
    Commented Aug 8, 2018 at 15:14
  • $\begingroup$ I provided an approach that I think works for your case, using Plot3D. I could not think of a clean way to do this using ContourPlot. Please let me know if this does in fact work for you, and if not I'll try again. $\endgroup$
    – Mr.Wizard
    Commented Aug 9, 2018 at 1:03
  • $\begingroup$ @Mr.Wizard, thank you so much! It's working very well. $\endgroup$
    – SAC
    Commented Aug 9, 2018 at 22:59

1 Answer 1

2
$\begingroup$

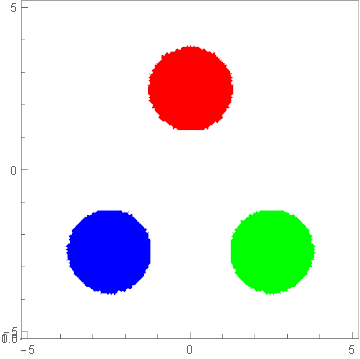
Addressing the case were a, b, c are all zero, it seems easiest to me to use Plot3D for this case, with the addition of ClipPlanes. I used a small offset (-0.03) for the position of the plane to remove some of the noise that occurs if I use 0 in its place.

t = 0;

Block[{x, y, val = Through @ sol[[1, All, 2]][t, x, y]},
  Plot3D[val, {x, -5, 5}, {y, -5, 5}
   , PlotPoints -> 50
   , PlotStyle -> {Red, Blue, Green}
   , Lighting -> {{"Ambient", White}}
   , Mesh -> False
   , ViewPoint -> {0, 0, ∞}
   , ClipPlanes -> {{0, 0, 1, -0.03}}
  ]
]

enter image description here


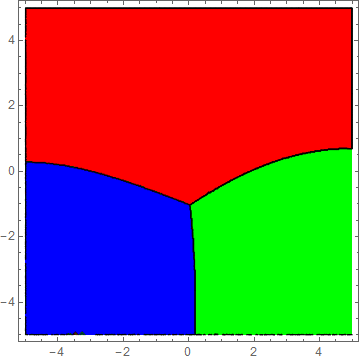
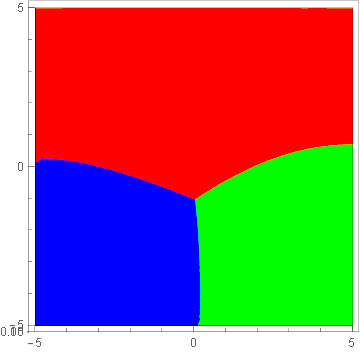
For some reason imgur images are not loading for me at the moment so I cannot see your goal plot. However I think I get the idea of what you want, and we can apply Michael's method from Plot the plane so different condition has a different color like this:

t = 5;

ContourPlot[
  Ordering[Through @ sol[[1, All, 2]][t, x, y], -1],
  {x, -5, 5}, {y, -5, 5}
  , PlotPoints -> 50
  , ContourShading -> {Red, Green, Blue}
]

enter image description here

Or using Plot3D as in my own answer

Block[{x, y, val = Through @ sol[[1, All, 2]][t, x, y]},
  Plot3D[val, {x, -5, 5}, {y, -5, 5}
   , PlotPoints -> 50
   , PlotStyle -> {Red, Blue, Green}
   , Lighting -> {{"Ambient", White}}
   , Mesh -> False
   , ViewPoint -> {0, 0, ∞}
  ]
]

enter image description here

$\endgroup$

Your Answer

By clicking “Post Your Answer”, you agree to our terms of service and acknowledge you have read our privacy policy.

Not the answer you're looking for? Browse other questions tagged or ask your own question.