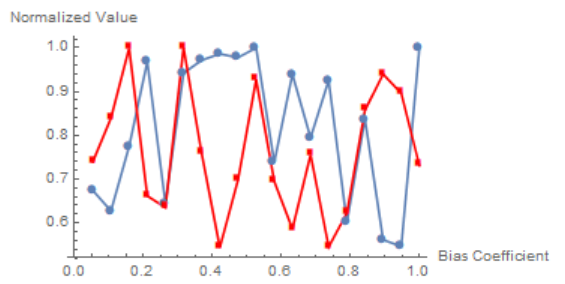
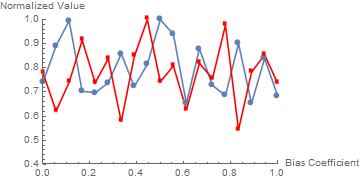
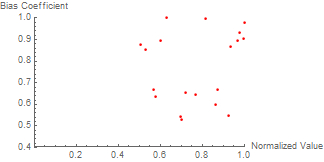
So, I have a plot similar to this one.
x = RandomReal[{0.5, 1}, 19]
y = RandomReal[{0.5, 1}, 19]

ListLinePlot[{y/Max[y], x/Max[x]}, PlotRange -> {{0, 19}, {0.4, 1}},
 PlotStyle -> {"97", Red}, PlotRangeClipping -> False,
 PlotMarkers -> Automatic, Ticks -> {Automatic, Automatic},
 AxesLabel -> {"Bias Coefficient", "Normalized Value"}]
What I would like to do is to change the values shown in the x axis to the normalized "Normalized Value" that were used to generate the lists in the first place (the values of X and Y at the sample code are dummies), which I would like to input by hand.
Thank you for your help!


DataRange -> {0, 1}? $\endgroup$