I am trying to gain an in depth understanding of how discrete fourier transforms work, and consequently I am trying to implement the discrete fourier transform myself in the form of a matrix.
First we initialize some parameters
n = 100; (* number of points *)
sr = 10;(* sample rate *)
dt = 1/sr; (* time increment *)
df = sr/nn; (* frequency Increment *)
f1 = 2;
p = 1/f1;
a = 5;
Generate a Periodic Data set where we know the frequency f1
data = Table[N[{t, a Cos[2 Pi f1 t]}], {t, 0, dt (nn - 1), dt}];
Perform the DFT as implemented in Mathematica and generate a frequency axis
ft = Fourier[data[[All, 2]], FourierParameters -> {-1, -1}];
freqs = Table[(n - 1) sr/nn, {n, nn}];
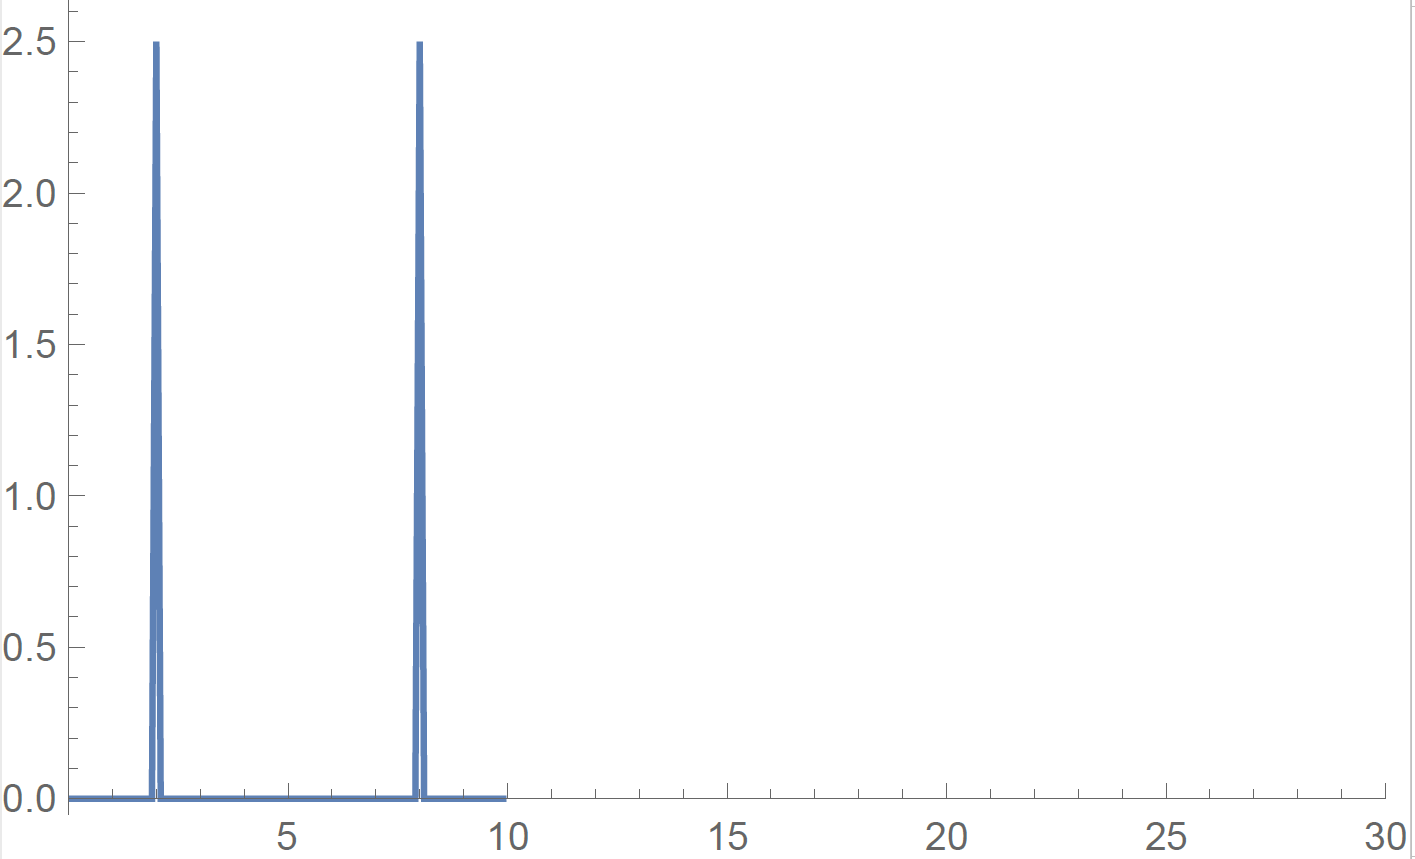
ListPlot[Transpose[{freqs, Abs[ft]}], PlotRange -> {{0, 30}, All},
 Joined -> True]
Now Try to implement as a matrix equation by first calculating the matrix W
w = Table[
   N@Exp[ (-I 2 Pi j k)/nn],
   {j, 0, dt (nn - 1), dt},
   {k, 0, dt (nn - 1), dt}];
Multipy the data vector and the matrix W, and plot the absolute value
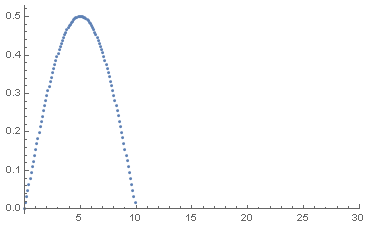
discretefourier = Transpose[{freqs, Abs[dt (w.data[[All, 2]])]}];
ListPlot[discretefourier, PlotRange -> {{0, 30}, All}]
What did I do wrong?


