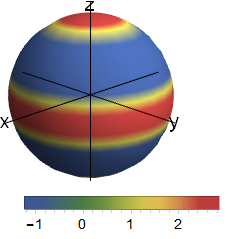
If anyone has any idea how to turn all of that plotting stuff (hcpii4plot) into a function which takes hcpii4angfunc[θ, ϕ] as an argument, that would make my notebook a lot neater and easier to read. I have been struggling with this for a couple of months now and couldn't find how to do it anywhere online...
hcpii4angfunc[θ_, ϕ_] = -1.1619488688971678` +
  0.8938068222285906` Cos[2 θ] +
  3.1283238778000673` Cos[2 θ]^2

hcpii4plot =
  SphericalPlot3D[1, {θ, 0, π}, {ϕ, 0, 2 π},
   ColorFunction ->
    Function[{x, y, z, θ, ϕ, r},
     ColorData["DarkRainbow"][hcpii4angfunc[θ, ϕ]]],
   ColorFunctionScaling -> False, Mesh -> False, Boxed -> False,
   AxesOrigin -> {0, 0, 0},
   PlotRange -> {{-1.3, 1.3}, {-1.3, 1.3}, {-1.22, 1.22}},
   LabelStyle -> Directive[Black, 14], Ticks -> None,
   AxesStyle -> Arrowheads[{-0.05, 0.05}],
   Method -> {"ShrinkWrap" -> True}, ViewPoint -> {-2, -2, 1},
   ViewVertical -> {1, 1, 1}];
Graphics[Inset[hcpii4plot, Center, Center, ImageScaled[1]],
 Epilog -> {Text[Style["x", FontSize -> 20],
    ImageScaled[{0.03, .33}]],
   Text[Style["y", FontSize -> 20], ImageScaled[{.97, .33}]],
   Text[Style["z", FontSize -> 20], ImageScaled[{.5, .99}]]}]
BarLegend[{"DarkRainbow", {MinValue[
    hcpii4angfunc[θ, ϕ], {θ, ϕ}],
   MaxValue[hcpii4angfunc[θ, ϕ], {θ, ϕ}]}},
 LegendLayout -> "Row", LabelStyle -> Directive[Black, 14]]
Any help would be greatly appreciated!

