I had a task of filtering data with various timestamps on it, and proceeded as instructed. The first option was to use TimeSeries which works fine but somewhat slow, and the second one TemporalData which operated much faster. However sometimes the second option gives completely bogus results, looking nothing like filtered values at all. Is there a way to fix it?
data = TemporalData[Table[{(i/100.)^2, i/100 + SquareWave[(i/100.)^2] + RandomReal[{-0.1, 0.1}]}, {i, 1,1000}]];
ans = AbsoluteTiming[LowpassFilter[data, Quantity[1, "Hertz"]]];
ans[[1]]
ListLinePlot[{data, ans[[2]]}]
data = Table[{(i/100.)^2, i/100 + SquareWave[(i/100.)^2] + RandomReal[{-0.1, 0.1}]}, {i, 1, 1000}];
ans = AbsoluteTiming[LowpassFilter[TimeSeries@data, Quantity[1, "Hertz"]]];
ans[[1]]
ListLinePlot[{data, ans[[2]]}]
This is how it should look like:
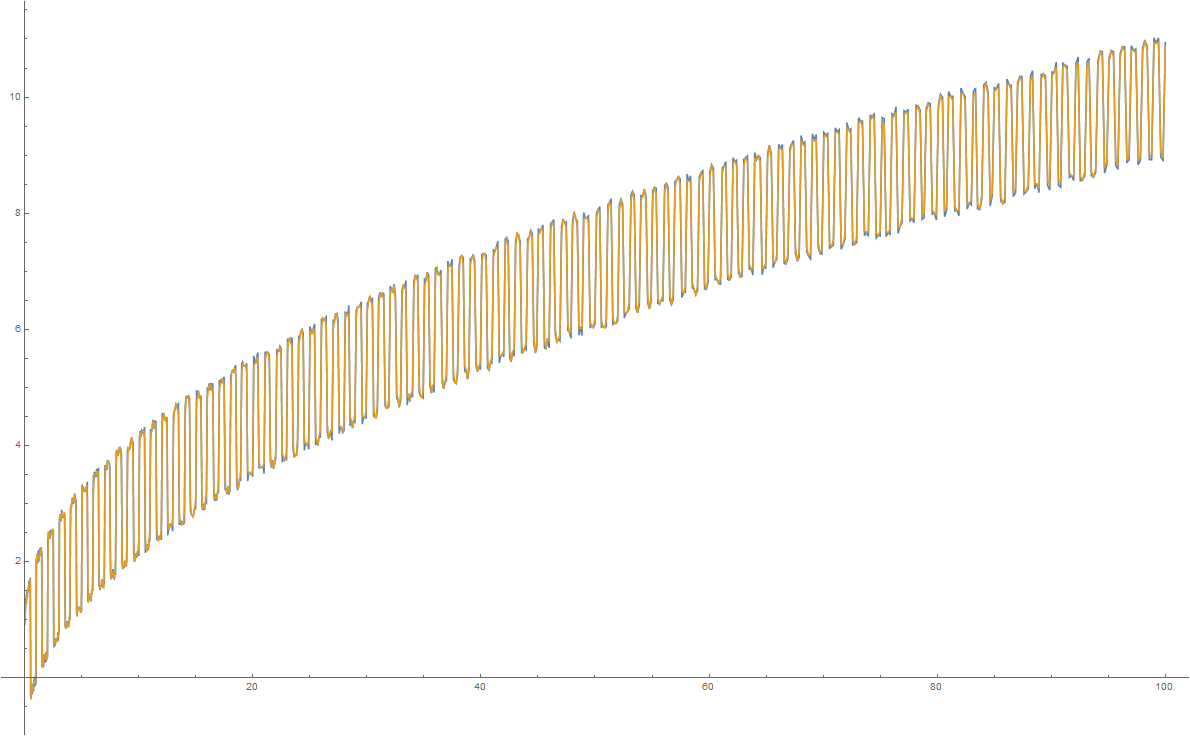
However if you put 1500 points in array instead of 1000 results look exactly the same.
As suggested in comments, this issue can be solved by adding "Path" after the data array, however I was unable to filter an Example of real data using this fix:
\[Tau]1 = TemporalData[a0];
f1 = LowpassFilter[\[Tau]1["Path"], Quantity[1, "Hertz"]];
ListPlot[{\[Tau]1, f1}]
This filtering doesn't even change the data:
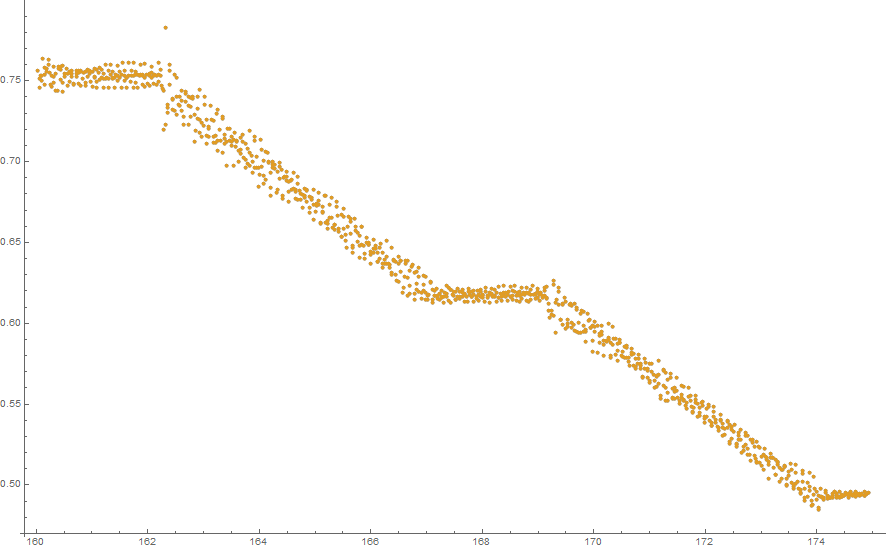
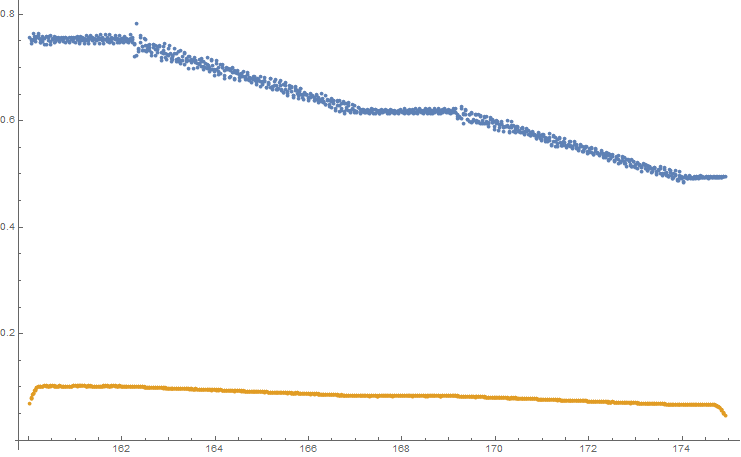
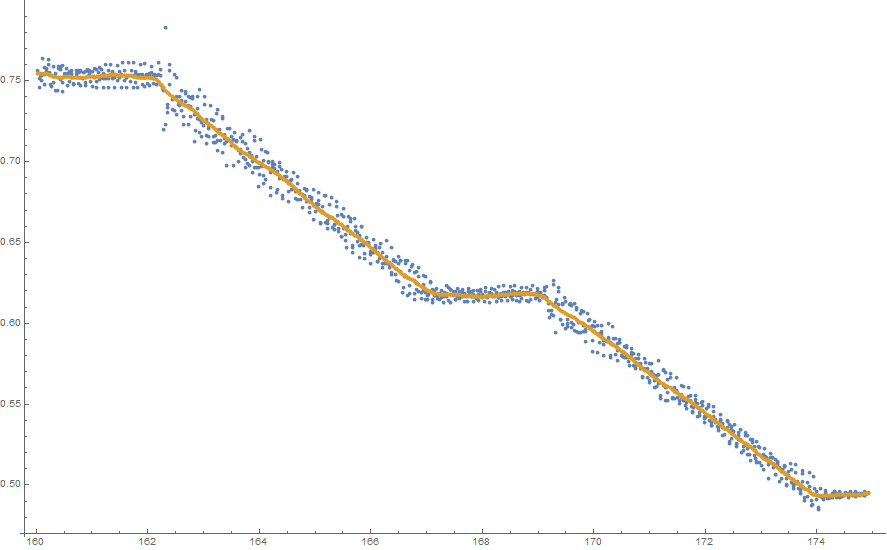
When I remove "Path" weird results appear yet again (yellow points are supposed to be filtered):
Note that if you swap it for TimeSeries@ it works as intended (but much slower, which is my main problem):
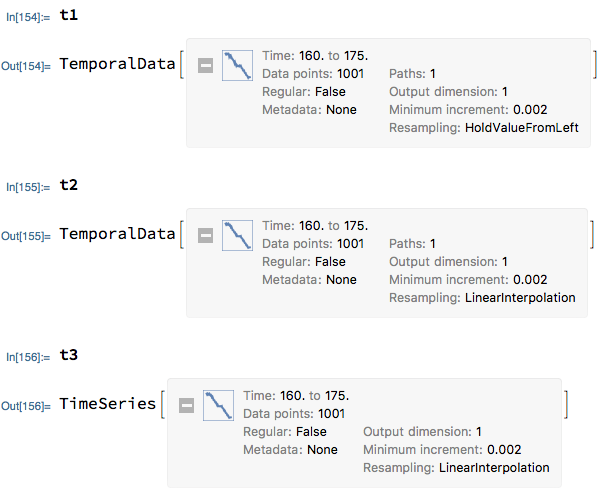
\[Tau]1 = TemporalData[a0];
f1 = LowpassFilter[TimeSeries@\[Tau]1, Quantity[1, "Hertz"]];
ListPlot[{\[Tau]1, f1}]

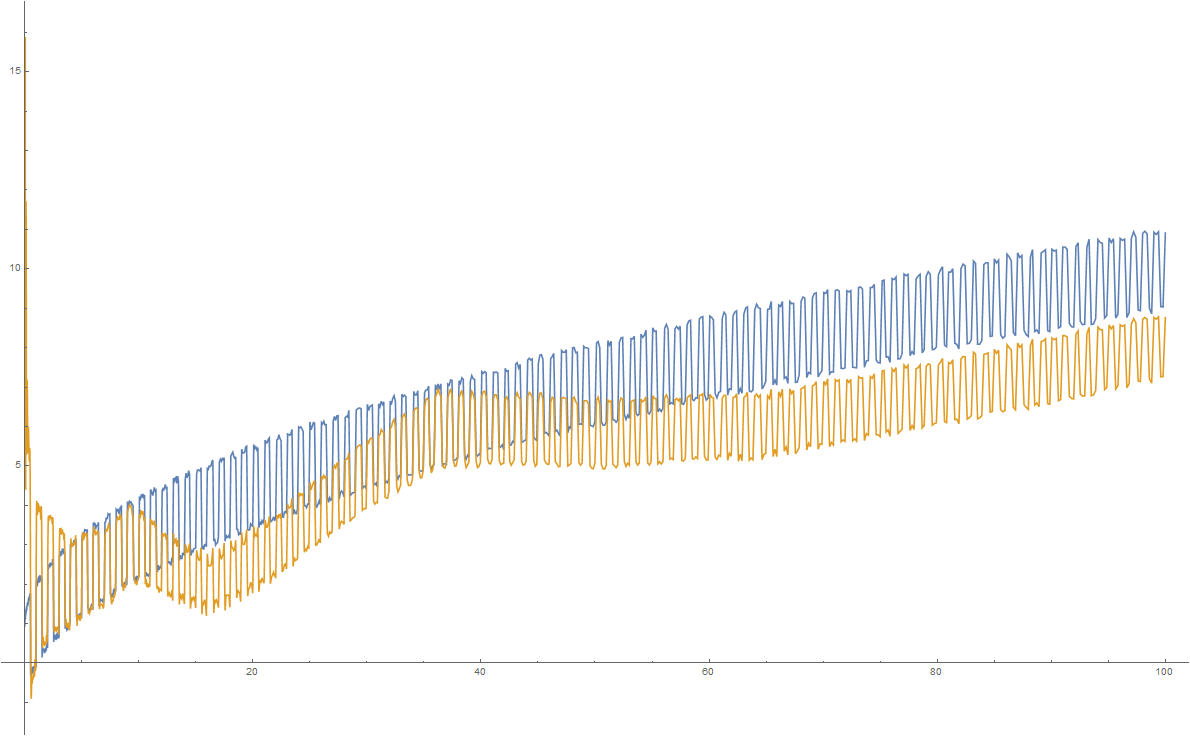

ans = AbsoluteTiming[LowpassFilter[data["Path"], Quantity[1, "Hertz"]]];in the first code block? $\endgroup$