I have what should be a rather simple problem, but I am struggling with an elegant solution.
I have a nested list of values of the form {{x1,y1,p1},{x2,y2,p2},...{xn,yn,pn}} where p corresponds to the variable pair x and y.
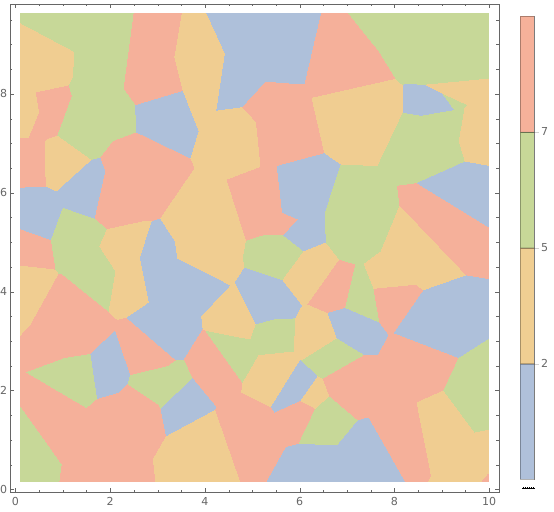
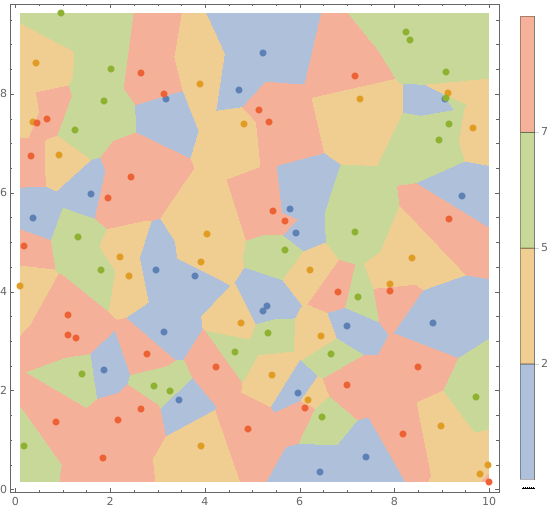
Ultimately, I want to make RegionPlots on the y-x plane of the points for which p < some value, i.e., I want to make a plot of the region where p < 5, then do the same for p < 7, etc. Ideally I would like to plot these regions on the same plot, with different colored dots depending on the p-value.
I am struggling with working with the nested list (despite having looked through the documentation), and having RegionPlot refer to particular list elements and compare with the third element of each nested set. Any help would be much appreciated.


ListPlot3D[xxx, RegionFunction-> Function[{z}, z<5]]$\endgroup$ListContourPlot. It accepts data in exactly your format, and you can easily specify which contours to draw usingContours(i.e. which regions). $\endgroup$Select? $\endgroup$Selectwill allow you to select the data that obeys some constraint, but if you useRegionPlotor simpleListPlot3D, etc., you will likely get the full range of positions, not restricted to where the data lie. $\endgroup$Select[list, 5 < Last[#] < 7 &], although I am not sure how to pass this into a RegionPlot argument? $\endgroup$