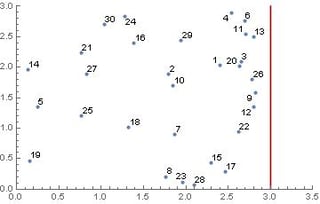
I have a plot as below (the plot is just for illustration purpose. in my real problem, I just have pts1):-
pts1 = BlockRandom[SeedRandom[7]; RandomReal[2.9, {30, 2}]];
pts1L = MapThread[Labeled[#1, #2] &, {pts1, Range[Length@pts1]}];
plot1 = ListPlot[pts1L, PlotRange -> {{0, 3.5}, {0, 3}}];
plot2 = ParametricPlot[{3, t}, {t, 0, 3}, PlotStyle -> Darker[Red]];
Show[plot1, plot2]
When I have a vector representing the red line, let say redLine = {0, 0.5, 1, 1.5, 2, 2.5, 3}, I want to have the coordinates of the closet points as output, i.e. {pts1[[17]], pts1[[17]], pts1[[22]], pts1[[9]], pts1[[26]],
pts1[[13]], pts1[[6]]} as output.
My current solution is as below, but that's too clumsy and will be very slow when the scale of the problem increase. What are the more efficient ways to get it done? (For example, is it possible to calculate the DistanceMatrix of just "frontline points v.s. red line" instead of "all points v.s. red line"?)
redLine = {0, 0.5, 1, 1.5, 2, 2.5, 3}
redLineCood = Transpose@ArrayFlatten[{ConstantArray[3, Length@redLine], redLine}]
dM = DistanceMatrix[redLineCood, pts1];
min = Min /@ dM;
pts1[[Flatten@MapThread[Position[#1, #2] &, {dM, min}]]]
Many thanks!


redLineCood={3,#}&/@redLine;$\endgroup$Nearest[pts1] /@ Thread[{3, redLine}]works so well! $\endgroup$