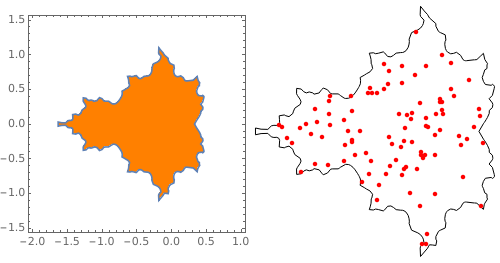
I've searched everywhere for this but can't seem to find a simple way to do this. I have defined a function of two variables and am able to plot a 2D region in the domain space - the endpoints of the domain I specify in RegionPlot - where a certain inequality holds true (f>0).
What I want however is the data represented by the plot region --
- the data points (x,y) along the 'boundary' of the region would be useful to me.
- More importantly, getting a list of all the data points inside the region (maybe 100 or 1000 PlotPoints, however fine I can get).
Is there any easy way to do this from the plot? Or from the initial inequality expression that I defined and from a list of the domain of x,y values?

