I have a set of data
data = Import["https://pastebin.com/raw/aqUwN2XR", "List"];
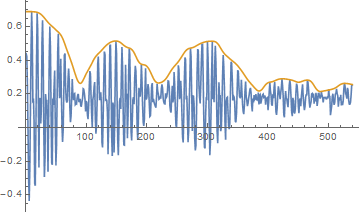
that gives me a graph that looks as though it has two oscillating sinusoidal envelopes. I can plot the envelope function for the full graph:
using
data = Flatten[Import["Data1.xlsx"]];
ListLinePlot[{data, envtop = GaussianFilter[MaxFilter[data, 10], 10]},PlotRange -> All]
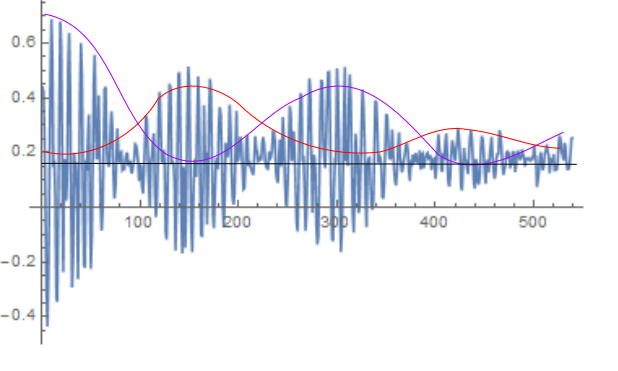
but it looks as if the first and third peak represent one decaying sine wave and the third and fourth peak are a separately decaying sine wave. Ideally I want to fit two envelopes, one that ignores the second and fourth peaks and one that ignores the first and third. I only want to fit this for the top envelope and don't really care about the negative values. Is there a way to do this?
Drawing of the type of fit I want:


NonlinearModelFiton both or do a singleNonlinearModelFitwith twoSincomponents in the model (or maybe aSinandCossum since it looks like yours are perfectly out of phase). $\endgroup$