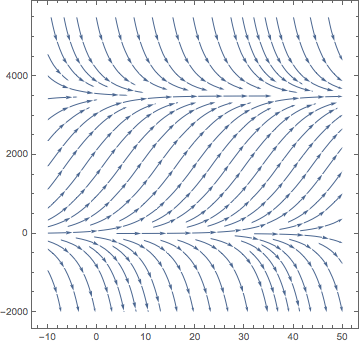
My command below does not give a very informative StreamPlot. What am I doing wrong? Similar problem with VectorPlot. VectorScale -> Automatic and StreamPoints -> Automatic give unsatisfying results. What could I do better?
StreamPlot[
 {1, 1/5 y (1 - y/3500)},
 {x, -10, 50}, {y, -2000, 5500},
 PlotRange -> {{-10, 50}, {-2000, 5500}},
 StreamPoints -> Automatic
]

VectorPlot[
 {1, 1/5 y (1 - y/3500)},
 {x, -10, 50}, {y, -2000, 5500},
 PlotRange -> {{-10, 50}, {-2000, 5500}},
 VectorStyle -> Arrowheads[0],
 VectorScale -> Automatic,
 StreamPoints -> Automatic
]

