30
$\begingroup$

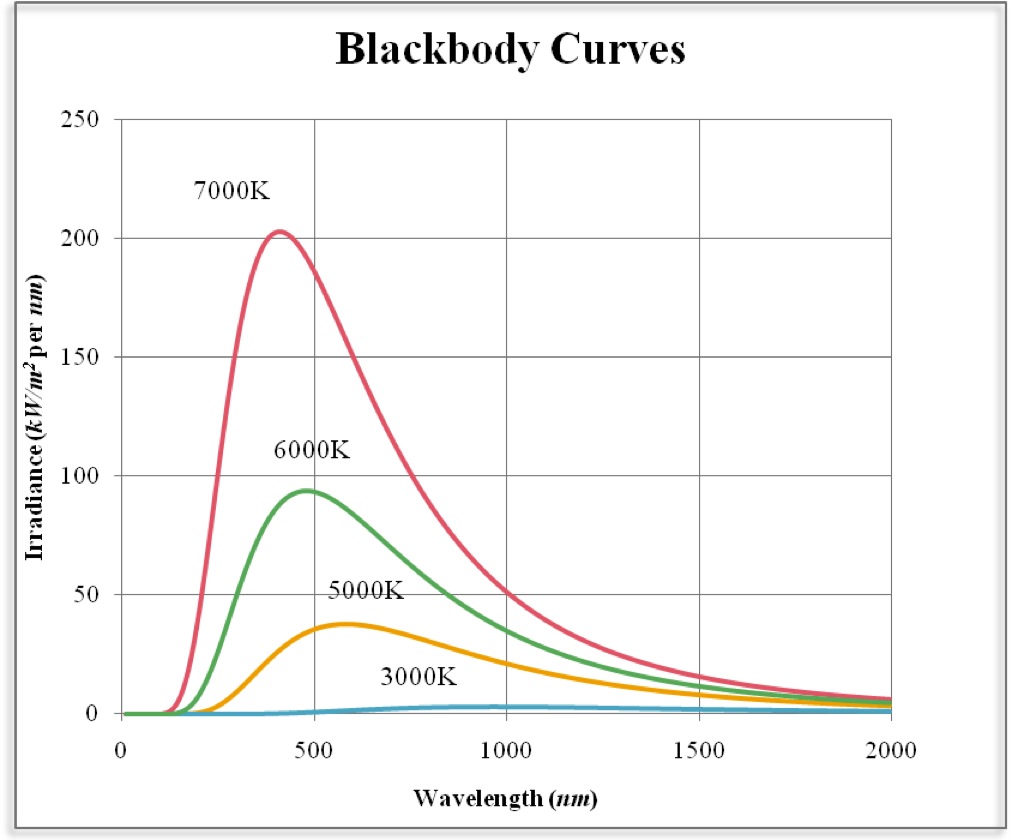
Presume that I have a spectrum as a function of wavelength (an example being the blackbody spectrum):

blackbody curves

I want to convert that to a single RGB color to display on-screen, i.e. the "color" of that object as it would appear to the eye. From searching, I can see that there are ways to do this with a matrix transformation for a single wavelength, but I was hoping someone already had a solution coded up in Mathematica for an arbitrary input spectrum.

$\endgroup$
6
  • 1
    $\begingroup$ What makes you think that you can input an arbitrary continuous wavelength spectrum and create with a (highly monitor specific) mixture of 3 other wavelength spectra (namely red, green and blue) light which gives your brain the same impression as it would have seen the original spectrum? $\endgroup$
    – halirutan
    Commented Aug 15, 2014 at 0:40
  • $\begingroup$ @halirutan Within the gamut limitation of the display that is a standard assumption. It is far from simple however. Guillochon, even a basic introduction to color theory shows that this is not a simple subject. I am inclined to close this as "requires the services of a professional consultant." Without an algorithm to implement the vast majority of work on this doesn't specifically relate to Mathematica. I dabbled in this stuff in the past but I never knew enough to derive an algorithm and I've forgotten much. $\endgroup$
    – Mr.Wizard
    Commented Aug 15, 2014 at 0:48
  • 2
    $\begingroup$ @mr.wizard. The question isnt really that complicated. If there aren't any answers by tonight I'll give it a try. Shouldn't take more than 15 minutes. $\endgroup$ Commented Aug 15, 2014 at 6:32
  • $\begingroup$ @halirutan From reading about it online I agree that it doesn't seem too simple, however it doesn't need to be the perfect solution. Mathematica already has some color transformation functions available, so I thought there might be some easy way to relate the matrix transformations to built-in Mathematica functions. $\endgroup$
    – Guillochon
    Commented Aug 15, 2014 at 12:10
  • $\begingroup$ @Sjoerd I look forward to your answer. I don't imagine that the computation itself is that involved but the derivation is. Individuals see color differently, and perceived color depends greatly on contrast, illumination (both spectrum and intensity, e.g. Kruithof curve), field of view, adaptation, etc. I suppose though these effects are to be ignored and a "standard observer" used however. Since commenting I learned that version 10 now includes LABColor and XYZColor which if correctly implemented should simplify conversion to monitor RGB. $\endgroup$
    – Mr.Wizard
    Commented Aug 15, 2014 at 14:37

5 Answers 5

32
$\begingroup$

I got my CIE color matching functions from here. These are the CIE 1931 2-deg, XYZ CMFs modified by Judd (1951) and Vos (1978).

{λ, x, y, z} = 
  Import["http://www.cvrl.org/database/data/cmfs/ciexyzjv.csv"]\[Transpose];

ListLinePlot[{{λ, x}\[Transpose], {λ,y}\[Transpose], {λ, z}\[Transpose]}, 
 PlotLegends -> {"X", "Y", "Z"}]
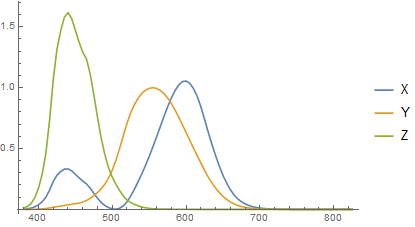
color matching functions

Conversion of color temperature to XYZ tristimulus values is done using Planck's radiation law. Note that I make use of vectorization to calculate the integration of the product of black body radiation and the color sensitivity curves over wavelength. I also scale the output to make Y (more or less the luminance) equal to 1.

λ = λ 10^-9; (* wavelength is given in nm *)

XYZ[t_] :=
 Module[{h = 6.62607*10^-34,c = 2.998*10^8, k = 1.38065*10^-23},
  {x, y, z}.((2 h c^2)/((-1 + E^((h c/k)/(t λ))) λ^5)) // #/#[[2]] &
  ]

With V10 there are two convenient functions that perform the rest of the transformation for us: XYZColor and ColorConvert (updated):

ColorConvert[XYZColor @@ XYZ[temp], "RGB"]

Example:

Graphics[
 Table[
  {
   ColorConvert[XYZColor @@ XYZ[i], "RGB"],
   Rectangle[{i, 0}, {i + 50, 5000}]
   },
  {i, 100, 10000, 50}
  ],
 Frame -> True, FrameTicks -> {Automatic, None, None, None},
 FrameLabel -> {"Black body temperature (K)", "", "", ""}
 ]
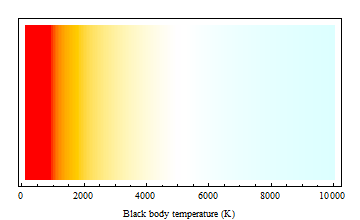
blackbody spectrum

Note that some clipping can take place in the conversion from XYZ to RGB (sRGB has a rather restricted gamut):

ChromaticityPlot[
 {
  "sRGB",
  Table[ColorConvert[XYZColor[XYZ[i]], "RGB"], {i, 100, 40000, 50}],
  Table[XYZColor@XYZ[i], {i, 100, 40000, 50}]
  }
 ]
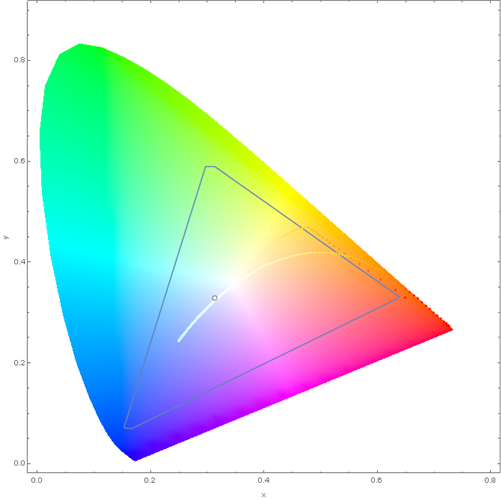
chromaticity plot of blackbody spectrum

Scaling the XYZ values down somewhat (here with a factor of 2) may provide a solution in some cases:

ChromaticityPlot[
 {
  "sRGB",
  Table[ColorConvert[XYZColor[XYZ[i]/2], "RGB"], {i, 100, 40000, 50}],
  Table[XYZColor@XYZ[i], {i, 100, 40000, 50}]
  }
 ]
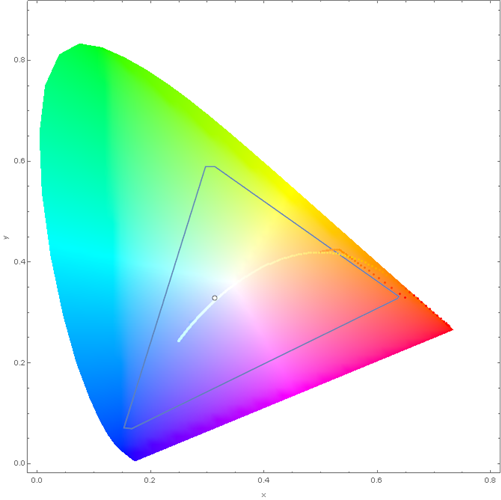
scaled chromaticity plot of blackbody spectrum

$\endgroup$
9
  • $\begingroup$ Nice! I wasn't too far wrong then, just got the normalisation wrong (as I suspected). It seems that the built-in "BlackBodySpectrum" is not quite right. $\endgroup$ Commented Aug 15, 2014 at 21:05
  • 2
    $\begingroup$ @SimonWoods Color science borders on black magic. $\endgroup$ Commented Aug 15, 2014 at 21:31
  • $\begingroup$ @Sjoerd Please check the definition for XYZ: isn't there a misprint in your code? I cannot reproduce your plots under Win7 x64 with MMa 10.0.0. $\endgroup$ Commented Aug 16, 2014 at 10:12
  • $\begingroup$ @AlexeyPopkov I forgot to copy the line of code that gives the downloaded wavelengths the proper size (nm). Added now; thanks for pointing this out. $\endgroup$ Commented Aug 16, 2014 at 12:07
  • $\begingroup$ @Sjoerd Thanks, reproduced now. $\endgroup$ Commented Aug 16, 2014 at 12:12
23
$\begingroup$

I thought I'd share my attempt at this, even though it doesn't seem to have worked properly.

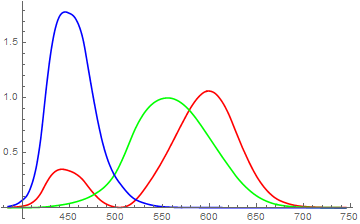
The CIE color matching functions are tabulated in the Image`ColorOperationsDump context which is used by ChromaticityPlot. The context can be loaded by calling ChromaticityPlot and then we can interpolate the data to obtain functions:

ChromaticityPlot["RGB"];

{x, y, z} = Interpolation[
   Thread[{Image`ColorOperationsDump`$wavelengths, #}]] & /@ 
   Transpose[Image`ColorOperationsDump`tris];

Plot[{x[λ], y[λ], z[λ]}, {λ, 385, 745}, PlotStyle -> {Red, Green, Blue}]

enter image description here

The X, Y and Z tristimulus values are obtained by integrating the functions over the spectrum, so define the spectrum and the integration:

h = 6.63*^-34;  c = 3.0*^8;  k = 1.38*^-23;  nm = 10^-9;

spectrum[T_, λ_] := (λ nm)^-5/(Exp[h c/(λ nm k T)] - 1)

xyzcolor[T_] := NIntegrate[Through[{x, y, z}[λ]] spectrum[T, λ], {λ, 385, 745}]/
  NIntegrate[spectrum[T, λ], {λ, 385, 745}]

I've normalised the integral by the total power in the spectrum, but this may not be the correct approach.

ColorConvert can be used to convert the XYZ color to RGB. Note that I had to multiply the XYZ color by an arbitrary constant to get the results not to be too dark (this is why I'm not sure about the normalisation).

rgbcolor[T_] := ColorConvert[3 xyzcolor[T], "XYZ" -> "RGB"]

Here are the colors obtained for temperatures from 500K to 8000K (bottom row) with the results from the built-in "BlackBodySpectrum" above.

Graphics[Table[{
   rgbcolor[500 t], Disk[{t, 0}, 0.4],
   ColorData["BlackBodySpectrum"][500 t], Disk[{t, 1}, 0.4]}, {t, 16}],
 Background -> Black]

enter image description here

They are clearly rather different :-(

$\endgroup$
4
  • 1
    $\begingroup$ Yours might be closer to Wikipedia's than to Mma's. +1 for the spelunking at least. $\endgroup$
    – Michael E2
    Commented Aug 15, 2014 at 19:34
  • 2
    $\begingroup$ I guess 500K should be somewhat dark. $\endgroup$
    – Michael E2
    Commented Aug 15, 2014 at 19:45
  • 2
    $\begingroup$ @MichaelE2, I enjoy a bit of spelunking, but it does frustrate me sometimes that gems like CIE color matching functions are built in but not made easily available. $\endgroup$ Commented Aug 15, 2014 at 21:14
  • $\begingroup$ @SimonWoods Can you show me how to do it for a given spectrum ? mathematica.stackexchange.com/questions/170498/… $\endgroup$
    – james
    Commented Apr 5, 2018 at 18:57
9
$\begingroup$

Here, finally, is the direct analog of newVisibleSpectrum from this answer, which can be used to replace ColorData["BlackBodySpectrum"].

ChromaticityPlot; (* pre-load internals *)

newBlackBodySpectrum[t_?NumericQ] :=
   With[{planck = 1/((Exp[1.43877696*^7/(# t)] - 1) #^5) &}, 
        XYZColor @@ ({{1.0478112, 0.022886602, -0.050126976}, (* Bradford D65 -> D50 *)
                      {0.029542398, 0.9904844, -0.017049096},
                      {-0.0092344897, 0.015043617, 0.75213163}} .
                     Normalize[planck[Image`ColorOperationsDump`$wavelengths] .
      Image`ColorOperationsDump`tris, #[[2]] &])]

The Bradford chromatic adaptation matrix was needed here since Mathematica assumes a D50 whitepoint for XYZColor[] (see the docs for ColorConvert[]).

Now, 6500 K corresponds to white, as it is supposed to be for D65:

ColorConvert[newBlackBodySpectrum[6500], RGBColor]

Graphics[{newBlackBodySpectrum[6500], Disk[]}]

practically white

Compare:

GraphicsColumn[{DensityPlot[x, {x, 1000, 10000}, {y, 0, 1500}, 
                            AspectRatio -> Automatic, PlotPoints -> {200, 3},
                            ColorFunction -> "BlackBodySpectrum", 
                            ColorFunctionScaling -> False, 
                            PlotLabel -> "BlackBodySpectrum"], 
                DensityPlot[x, {x, 1000, 10000}, {y, 0, 1500}, 
                            AspectRatio -> Automatic, PlotPoints -> {200, 3},
                            ColorFunction -> newBlackBodySpectrum,
                            ColorFunctionScaling -> False,
                            PlotLabel -> "newBlackBodySpectrum"]}]

blackbody spectrum comparison

$\endgroup$
9
$\begingroup$

Borrowing the analytically-fitted color matching functions cieX, cieY, cieZ and sRGBGamma from this answer, here is a function for generating the colors of the black body spectrum. The conversion being done here assumes a luminance (Y in the XYZ system) of 1:

With[{planck = 1/((Exp[1.43877696*^7/(#1 #2)] - 1) #1^5) &,
      tab = Through[{cieX, cieY, cieZ}[Range[380, 780]]]},

     myBlackBodySpectrum[t_?NumericQ] := RGBColor @@ Clip[sRGBGamma[
                {{3.2404542, -1.5371385, -0.49853141},
                 {-0.96926603, 1.8760108, 0.041556017},
                 {0.055643431, -0.20402591, 1.0572252}} . 
                Normalize[tab.planck[Range[380, 780], t], #[[2]] &]], {0, 1}]]

(For version 10, see my other answer).

Compare:

GraphicsColumn[{DensityPlot[x, {x, 1000, 10000}, {y, 0, 1500}, 
                            AspectRatio -> Automatic, PlotPoints -> {200, 3},
                            ColorFunction -> "BlackBodySpectrum", 
                            ColorFunctionScaling -> False, 
                            PlotLabel -> "BlackBodySpectrum"], 
                DensityPlot[x, {x, 1000, 10000}, {y, 0, 1500}, 
                            AspectRatio -> Automatic, PlotPoints -> {200, 3},
                            ColorFunction -> myBlackBodySpectrum,
                            ColorFunctionScaling -> False,
                            PlotLabel -> "myBlackBodySpectrum"]}]

blackbody spectrum comparison

$\endgroup$
2
  • $\begingroup$ I note an issue with this effort: the white point is not as it should be. My display is calibrated for 6500K so that should look white, i.e. it should match the background of the page. Instead 5000K looks white. Would you be willing to take a look at that? (Edit: I guess my display is irrelevant; the point is that it is calibrated for sRGB which is 6500K, and I think this spectrum is also supposed to be rendered in sRGB, but it does not seem right.) $\endgroup$
    – Mr.Wizard
    Commented Aug 2, 2015 at 22:00
  • 1
    $\begingroup$ I finally figured it out; I should not have used the D50-adapted matrix (which explains why the white point was at 5000 K). I have made the necessary changes here (and in my other answer). $\endgroup$ Commented May 24, 2016 at 21:05
0
$\begingroup$

I think it's critical to look at rainbows to get insights into this, as you can calculate how the frequency shifts, and see what a constant intensity and single frequency would yield in RGB color. Then you can try superimposing multiple frequencies at different intensities. Here is a great photo I found online, and you should crop in to just the rainbow:

https://www.franklinarts.com/media/blog-images/Rainbow-in-Kauai.jpg

(You could also buy a triangular prism.)

Besides being able to read the RGB values from the image, you can get an idea of what makes sense. For example, you definitely see green in the rainbow. You do not see white. So earlier charts showing the spectrum cutting through white make no sense.

Yes, there's all kinds of issues to bring up with calibration, but it's worth asking if the prior solutions are even plausible? When I heat up a frying pan and make it glow, I am seeing only a small fraction of the spectrum. So I'm not convinced a black body spectrum is a representative sample of what you're trying to do.

$\endgroup$
1
  • $\begingroup$ Incidentally, the C code linked to by the OP does exactly what he asks - uses the experimental work from the CIE spectrum to reverse engineer the human eye stimulus to wavelength. There's a function in there spectrum_to_xyz you can use directly to convert a visible frequency to a CIE X Y Z color triplet, then use the xyz_to_rgb function to get RGB. $\endgroup$ Commented Oct 18 at 22:47

Your Answer

By clicking “Post Your Answer”, you agree to our terms of service and acknowledge you have read our privacy policy.

Not the answer you're looking for? Browse other questions tagged or ask your own question.