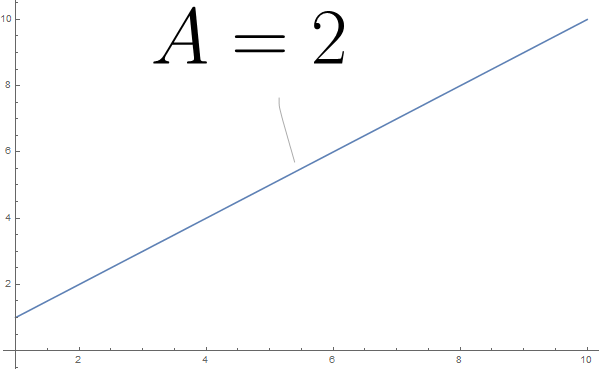
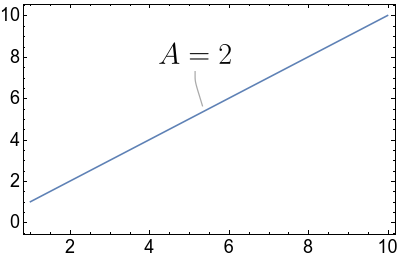
6
$\begingroup$

Recently, I tried to use Callout with the MaTeX objects. MaTeX is a package I downloaded in the following link http://szhorvat.net/pelican/latex-typesetting-in-mathematica.html

My test code is the following.

Plot[ Callout[ x, MaTeX["A=2", FontSize -> 40], Scaled[0.5]] , {x, 1,   10}]

I wanted to control the size of label by specifying the FontSize->40. However, Callout seems to rescale the size of the label. Is there a way to manually change the size of MaTeX object within Callout environment?

$\endgroup$
1
  • $\begingroup$ When you ask about MaTeX here, feel free to also drop a note in the Gitter channel: gitter.im/MaTeX-help/Lobby I didn't see this question when it was posted. $\endgroup$
    – Szabolcs
    Commented Mar 26, 2018 at 13:52

3 Answers 3

6
$\begingroup$

I assume you are using Mathematica 11.3. The resizing you observe is due to the new LabelingSize feature.

The default is LabelingSize -> Automatic, which limits the size of graphics and images (but not text) in labels. MaTeX output is always a Graphics expression, thus it is resized by default. The workaround is LabelingSize -> Full.

Plot[Callout[x, MaTeX["A=2", FontSize -> 32], Scaled[1/2]], {x, 1, 10}, LabelingSize -> Full]
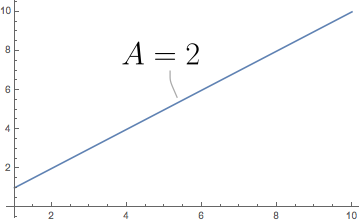
enter image description here

You may not want to use this workaround when you also have actual images/graphics that you use as labels, and you want those to be auto-scaled, but not the MaTeX labels. An alternative workaround is to wrap the MaTeX output with Pane (or similar) so that it won't be detected as Graphics.

Plot[Callout[x, Pane@MaTeX["A=2", Magnification -> 3], Scaled[1/2]], {x, 1, 10}]

In versions earlier than 11.3, these workarounds are not needed, as no automatic label scaling is done. I will add a note about this potential problem to the MaTeX documentation. Thanks for the feedback!


A note on Magnification vs FontSize in MaTeX:

  • FontSize is passed down to LaTeX and it affects the glyph shapes with some fonts

  • Magnification simply rescales LaTeX's output proportionally

These are demonstrated in the MaTeX symbol reference page, under Examples -> Options.

Using Magnification won't for your problem.

$\endgroup$
1
  • $\begingroup$ Both work perfectly. I $\endgroup$
    – Sungmin
    Commented Mar 26, 2018 at 13:58
1
$\begingroup$

You can use the Magnification option of MaTeX to manually change the size of the label within the Callout environment, as below:

Plot[Callout[x,MaTeX["A=2",FontSize->40,Magnification->2],Scaled[0.5]],{x,1,10},ImageSize->600]

enter image description here

$\endgroup$
5
  • $\begingroup$ Thanks. However it seems that this does not work in my environment. I am using Mathematica 11.3 in Ubuntu. $\endgroup$
    – Sungmin
    Commented Mar 21, 2018 at 7:27
  • $\begingroup$ Sorry to hear that. I'm using MMA 11.2 in Windows. What is the error message that you got? What version of pdflatex are you using? $\endgroup$
    – Vixillator
    Commented Mar 21, 2018 at 7:43
  • $\begingroup$ Have you tried to use LabelStyle -> 40 as an option in Callout? $\endgroup$ Commented Mar 22, 2018 at 16:31
  • $\begingroup$ LabelStyle does not work for Callout. Here is the error message:Callout::copos: {LabelStyle->40} is not a valid position for the placement of callouts. $\endgroup$
    – Vixillator
    Commented Mar 22, 2018 at 19:20
  • $\begingroup$ See my answer for why this does not work. $\endgroup$
    – Szabolcs
    Commented Mar 26, 2018 at 13:37
0
$\begingroup$

I cannot decide whether this is a bug or not, but I can also reproduce the Vixillator's plot with the older version 11.2 in Ubuntu.

I checked both InputForm of the Plot. This seems to suggest that in 11.3 the relevant expressions for MaTeX are now wrapped with DynamicModule. My limited investigation seems to show that, DynamicModule rescales the MaTeX object regardless of its actual size.

As a very ugly workaround, my tentative solution is as follows.

plot = Plot[
    Callout[x, f@MaTeX["A=2", FontSize -> 30], Scaled[0.5]], {x, 1, 
10}];

pos = plot // Cases[#, BSplineCurve[x___] -> x, Infinity] & // Last  //
   MaximalBy[ # [[1, 2 ]] &] // DeleteDuplicates // First //  ReplaceAll[ Offset[x_ , y_] :> Offset[ x  + {0, 15}, y]];
plot /. Text[Style[Rotate[f[ x__], ___], ___], ___] -> Inset[x, pos]

enter image description here

$\endgroup$

Your Answer

By clicking “Post Your Answer”, you agree to our terms of service and acknowledge you have read our privacy policy.

Not the answer you're looking for? Browse other questions tagged or ask your own question.