0
$\begingroup$

I have read these two Q&A:

PDF of the product of two independent Gamma random variables

How to Plot the PDF of Product of two Normals

I have two correlated Meixner random variables, $X$, and $Y$, where

$\qquad X\sim MXN(a=0.03306, b=0.30800, m=-0.00099, d=0.44168)$, $\qquad Y \sim MXN(a=0.03064, b=0.45599, m=-0.00173, d=0.51881)$

I need compute the product distribution the $Z=X \cdot Y$. The joint distribution of $X$ and $Y$ is the Student's $t$ copula model with two parametrs: correlation $\rho=0.722$ and degree of freedom $v=7.566$.

I have tried

Z = 
  TransformedDistribution[x*y, 
    {x \[Distributed] MeixnerDistribution[0.03306, 0.30800, -0.00099, 0.44168], 
     y \[Distributed] MeixnerDistribution[0.03064, 0.45599, -0.00173, 0.51881]}]

and TransformedDistribution gives Mean[Z]=2.50021*10^-6 output only.

Edit

I have tried Plot[PDF[Z, x], {x, 0, 1}] but the Mathematica software v.10 is running. I'm looking for the theoretical solution.

Question

How to compute the product distribution of two Meixner variables?

$\endgroup$
10
  • 1
    $\begingroup$ Hmm, I believe the first parameter of MeixnerDistribution[] ought to be positive. Maybe check if the definition you're using matches Mathematica's? $\endgroup$ Commented Mar 19, 2018 at 4:38
  • $\begingroup$ In support of @J.M.'s comment: MeixnerDistribution >> Details: MeixnerDistribution[a,b,m,d] allows m to be any real number, a and d to be any positive real number, and b such that -π <b<π. $\endgroup$
    – kglr
    Commented Mar 19, 2018 at 5:00
  • $\begingroup$ @kglr, I have edited the order of arguments in MeixnerDistribution[]. $\endgroup$
    – Nick
    Commented Mar 19, 2018 at 6:16
  • $\begingroup$ Version 11.3 fails with PDF[Z, x]. $\endgroup$
    – user64494
    Commented Mar 19, 2018 at 6:18
  • 1
    $\begingroup$ Up to Wiki (see en.wikipedia.org/wiki/Kendall_rank_correlation_coefficient ), the Kendall rank correlation coefficient is not it. The correlation (see en.wikipedia.org/wiki/Correlation_and_dependence ) is required. $\endgroup$
    – user64494
    Commented Mar 19, 2018 at 7:36

1 Answer 1

2
$\begingroup$

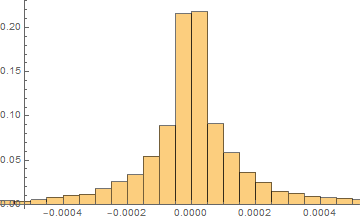
You can obtain an approximate plot of PDF[Z, x] in such a way.

Z = TransformedDistribution[x*y, {x \[Distributed]
MeixnerDistribution[0.03306, 0.30800, -0.00099, 0.44168], 
y \[Distributed] MeixnerDistribution[0.03064, 0.45599, -0.00173, 0.51881]}];
RandomVariate[Z, 10^4];Histogram[%, Automatic, "Probability"]

enter image description here

Addition. The answer which is valid for independent random variables was submitted before the edit of the question.

$\endgroup$
1
  • 1
    $\begingroup$ This is a good answer. "The next best thing to having an explicit formula for the probability density function is having a gazillion random samples from that distribution." (Are you going to modify to account for the OP's edit and maybe use SmoothKernelDistribution rather than a histogram?) $\endgroup$
    – JimB
    Commented Mar 19, 2018 at 14:22

Your Answer

By clicking “Post Your Answer”, you agree to our terms of service and acknowledge you have read our privacy policy.

Not the answer you're looking for? Browse other questions tagged or ask your own question.