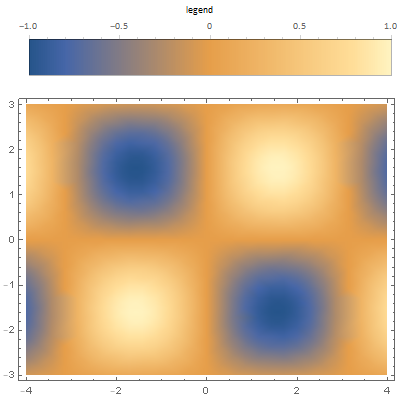
How can I have the barlegend positioned above the plot instead of to the right of the plot? I know there is a place command that is given by
Plotlegends -> Placed[Automatic,Above],
But I don't know how to combine barlegend with placed?
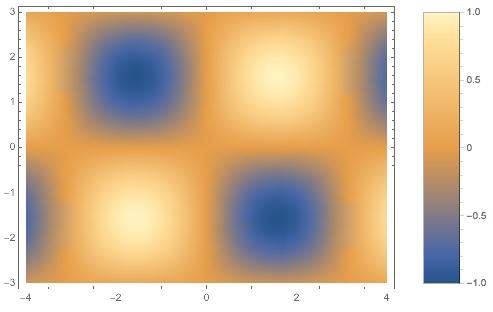
DensityPlot[Sin[x] Sin[y], {x, -4, 4}, {y, -3, 3},
 ImageSize -> {400, 300},
 PlotLegends -> BarLegend[Automatic, LegendMarkerSize -> {40, 300}],
 AspectRatio -> Automatic]
Example of when I try to combine BarLegend with Placed
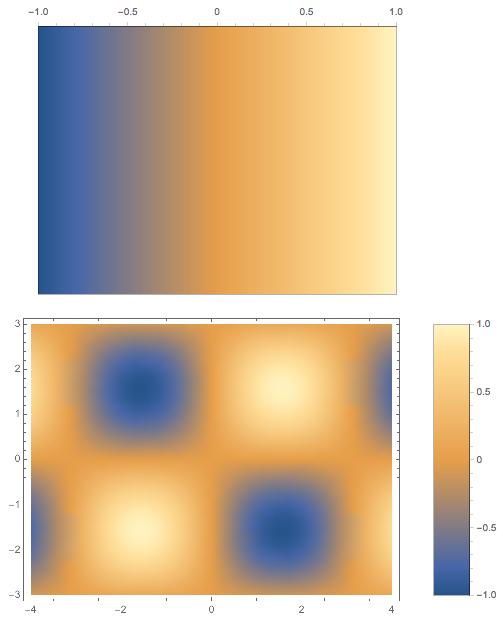
DensityPlot[Sin[x] Sin[y], {x, -4, 4}, {y, -3, 3},
 ImageSize -> {400, 300},
 PlotLegends -> {BarLegend[Automatic, LegendMarkerSize -> {40, 300}],
   Placed[Automatic, Above]},
 AspectRatio -> Automatic]
As you can see I now have two barlegends with one of them being the same size as the plot.


