2
$\begingroup$

I have following code

dist[a_, b_] = WeibullDistribution[a, b];
data = Table[
  j = Table[i = RandomVariate[dist[2, 1], {3, 3}], {i, 1, 4}], {j, 1, 
   3}]

above code generates 3*3 matrix four times and repeat all process three times. Next I want to grab the nearest value in each row as compare to random number with its rank (Minimum to maximum) in each row

data1 = Table[
  Table[Table[
    Nearest[data[[k, i, j]], RandomVariate[dist[2, 1]]], {j, 1, 
     3}], {i, 1, 4}], {k, 1, 3}]

Above code grabs the nearest value of the random number in each row. But I have no idea how to separate first, second and third ranked values. e.g in data1 we get total 36 values, some of them first ranked, some second and remaining third ranked.

$\endgroup$
2
  • $\begingroup$ you don't need to nest Table like that; you can write eg Table[{i,j,k},{i,1,2},{j,1,2},{k,1,2}]; your iteration compares each row in every matrix with a randomly generated number; Nearest returns a single number from each row: the one nearest to the random number generated each time; what do you mean "I have no idea how to separate first, second and third ranked values"? $\endgroup$
    – user42582
    Commented Feb 26, 2018 at 16:35
  • $\begingroup$ I have also observed the rank of the selected observation. There are three ranks in a row, so I need to know which one are first, second and third ranked values $\endgroup$
    – SAAN
    Commented Feb 26, 2018 at 18:01

3 Answers 3

2
$\begingroup$

Update: If the same random seed is used, the following matches the results in OP's self-answer:

SeedRandom[1]
dim = 3; mats = 4; n = 3;
data = RandomVariate[dist[2, 1], {n, mats, dim, dim}];
databt = RandomVariate[dist[2, 1], {n, mats, dim}];


TeXForm[data]

$$\tiny\left( \begin{array}{cccc} \left( \begin{array}{ccc} 0.449043 & 1.48137 & 0.48613 \\ 1.2932 & 1.19225 & 1.64987 \\ 0.782326 & 1.21024 & 0.962458 \\ \end{array} \right) & \left( \begin{array}{ccc} 0.596656 & 1.24579 & 0.538028 \\ 0.927759 & 1.18168 & 0.151963 \\ 0.438377 & 0.278683 & 0.740327 \\ \end{array} \right) & \left( \begin{array}{ccc} 1.10816 & 1.25299 & 0.737502 \\ 1.43155 & 1.08755 & 0.582804 \\ 0.969597 & 0.445523 & 1.05965 \\ \end{array} \right) & \left( \begin{array}{ccc} 0.72258 & 0.810115 & 1.33333 \\ 0.865783 & 0.462852 & 2.10634 \\ 1.07203 & 0.485768 & 2.10349 \\ \end{array} \right) \\ \left( \begin{array}{ccc} 0.96868 & 0.882563 & 0.882634 \\ 0.56402 & 0.484774 & 1.15524 \\ 1.10104 & 0.901214 & 1.70141 \\ \end{array} \right) & \left( \begin{array}{ccc} 0.85481 & 0.550826 & 1.26273 \\ 0.779351 & 0.758341 & 0.51416 \\ 0.164397 & 1.29721 & 0.815494 \\ \end{array} \right) & \left( \begin{array}{ccc} 1.05785 & 1.26957 & 0.784296 \\ 0.876061 & 1.13112 & 0.775078 \\ 0.750277 & 0.782584 & 0.38401 \\ \end{array} \right) & \left( \begin{array}{ccc} 0.636682 & 1.13854 & 0.666643 \\ 0.596915 & 1.05141 & 1.80751 \\ 1.5429 & 0.625666 & 0.935543 \\ \end{array} \right) \\ \left( \begin{array}{ccc} 0.182974 & 0.560791 & 1.04689 \\ 0.426948 & 0.308514 & 0.603491 \\ 1.26573 & 0.401616 & 0.632274 \\ \end{array} \right) & \left( \begin{array}{ccc} 1.22939 & 0.869507 & 1.23884 \\ 0.738202 & 0.753391 & 2.00657 \\ 0.240648 & 0.722363 & 1.55349 \\ \end{array} \right) & \left( \begin{array}{ccc} 1.35294 & 0.717737 & 1.27567 \\ 0.806159 & 1.00854 & 1.46412 \\ 1.40222 & 1.20532 & 0.663839 \\ \end{array} \right) & \left( \begin{array}{ccc} 1.81562 & 0.775681 & 1.38224 \\ 0.843356 & 1.44941 & 0.452277 \\ 0.79226 & 1.07275 & 0.771253 \\ \end{array} \right) \\ \end{array} \right)$$

nearestvalueF = Map[Nearest, data, {3}];
nearestvalues = MapThread[#[#2][[1]] &, {nearestvalueF, databt}, 3];
TeXForm[nearestvalues]

$$\tiny\left( \begin{array}{cccc} \{0.449043,1.19225,0.782326\} & \{0.538028,1.18168,0.740327\} & \{0.737502,1.08755,1.05965\} & \{1.33333,0.865783,0.485768\} \\ \{0.96868,0.484774,0.901214\} & \{0.85481,0.51416,0.164397\} & \{1.26957,1.13112,0.38401\} & \{0.636682,1.05141,0.935543\} \\ \{0.182974,0.426948,1.26573\} & \{1.22939,0.738202,0.240648\} & \{0.717737,1.46412,1.20532\} & \{1.38224,0.452277,0.771253\} \\ \end{array} \right)$$

rankofnearestF = Map[Nearest[Sort[#] -> Automatic] &, data, {3}];
ranksofnearest = MapThread[#[#2][[1]] &, {rankofnearestF, databt}, 3];
TeXForm[ranksofnearest]

$$\left( \begin{array}{cccc} \{1,1,1\} & \{1,3,3\} & \{1,2,3\} & \{3,2,1\} \\ \{3,1,1\} & \{2,1,1\} & \{3,3,1\} & \{1,2,2\} \\ \{1,2,3\} & \{2,1,1\} & \{1,3,2\} & \{2,1,1\} \\ \end{array} \right)$$

combined = MapThread[List, {nearestvalues, ranksofnearest}, 3];

With this result we can match rmin, rmedian and rmax in OP's self-answer is preceded with SeedRandom[1]:

Sort@Flatten@Pick[combined[[All, All, All, 1]], combined[[All, All, All, 2]], 1] 
  == rmin

True

Sort@Flatten@Pick[combined[[All, All, All, 1]], combined[[All, All, All, 2]], 2] 
  == rmedian

True

Sort@Flatten@ Pick[combined[[All, All, All, 1]], combined[[All, All, All, 2]], 3] 
   == rmax

True

Sort @ Tally @ Flatten @ ranksofnearest

{{1, 18}, {2, 9}, {3, 9}}

Length /@ {rmin, rmedian, rmax}

{18, 9, 9}

Legended[MatrixForm[Map[Style[#[[1]], (#[[2]] /. {1 -> Red, 2 -> Green, 3 -> Blue})] &, 
    combined, {-2}]], 
 Placed[Column[Style @@@ Transpose[{{"rank", "first", "second", "third"}, 
   {{Black, 16}, Red, Green, Blue}}], Dividers -> {False, 2 -> True}], Right]]
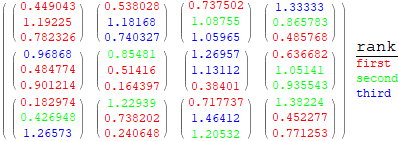
enter image description here

Note: In versions 10+, you can get the nearest values and their ranks using a single Nearest function:

nearestValuesAndRanksF = Map[Nearest[Sort[#] -> {"Element","Index"}] &, data, {3}];
combined2 = MapThread[#[#2][[1]] &, {nearestValuesAndRanksF, databt}, 3];
combined2 == combined

True


Original answer:

data1 = Table[Table[Table[
  Nearest[Sort@data[[k, i, j]] -> Automatic, RandomVariate[dist[2, 1]]][[1]], 
 {j, 1, 3}], {i, 1, 4}], {k, 1, 3}];

TeXForm @ data1

$$, \left( \begin{array}{cccc} \{1,1,2\} & \{1,1,1\} & \{3,3,1\} & \{1,2,3\} \\ \{1,2,3\} & \{2,3,2\} & \{1,1,2\} & \{3,3,3\} \\ \{1,3,2\} & \{3,3,2\} & \{2,1,3\} & \{3,1,3\} \\ \end{array} \right)$$

In versions 10+, you can also use "Index" instead of Automatic in the first argument of Nearest.

Update: a cleaner version without nested Tables:

datab = RandomVariate[dist[2, 1], {3, 4, 3, 3}];
nfs = Map[Nearest[Sort[#] -> Automatic] &, data, {3}];
databt = RandomVariate[dist[2, 1], {3, 4, 3}];
MapThread[#[#2][[1]] &, {nfs, databt}, 3]// TeXForm

$$ \left( \begin{array}{cccc} \{1,1,3\} & \{1,1,1\} & \{3,2,3\} & \{1,2,3\} \\ \{1,3,3\} & \{1,2,2\} & \{1,1,2\} & \{2,3,3\} \\ \{2,3,3\} & \{3,3,1\} & \{2,3,3\} & \{2,2,2\} \\ \end{array} \right)$$

$\endgroup$
3
  • $\begingroup$ I need ranked observations, not their ranked. Please see my answer. $\endgroup$
    – SAAN
    Commented Feb 27, 2018 at 4:15
  • $\begingroup$ @SAAN, please see the update. $\endgroup$
    – kglr
    Commented Feb 27, 2018 at 10:50
  • $\begingroup$ Nice answer, 1+ $\endgroup$
    – SAAN
    Commented Feb 27, 2018 at 11:14
1
$\begingroup$

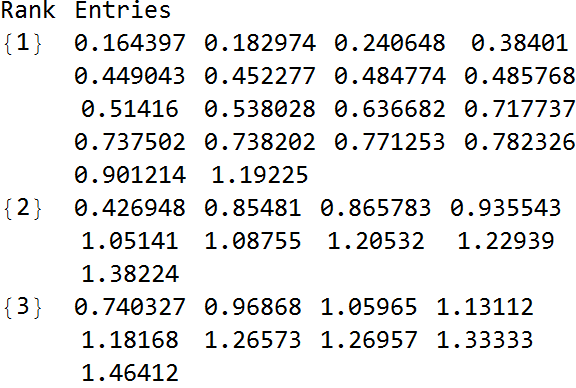
update

side-note: Coincidentally, I found out about this use of Partition from here; kudos to @kglr.

With[{dim = 3, mats = 4, n = 3},
 With[{a = 2, b = 1},
  BlockRandom[
   With[{rands = RandomVariate[WeibullDistribution[a, b], mats n dim^2]},
    Grid[
     Block[{f},
       (* f operates on matrix rows *)
       f = With[{row = {##}, rand = RandomVariate[WeibullDistribution[a, b]]},
             (* Nearest *)
             With[{near = First[Nearest[row, rand]]},
               (* rank of nearest *)
               {First[Position[Sort[row], near]], near}
              ]
            ] &;
       (* use Partition to construct the data and apply f on each row *) 
       With[{data = Partition[Partition[Partition[rands, dim, dim, {1, 1}, {}, f], dim], mats]},
         Apply[
           (* prepare output - operate on grouped data *)
           (* transpose grouped data, get an instance of the rank and the entries-prettify the entries *)    
           Through[{#[[1, 1]] &, Grid[Partition[#[[-1]], 4, 4, {1, 1}, {}]] &}[Transpose[{##}]]] &,
           (* flatten output from f, sort by rank and then group by rank *)
           GatherBy[Sort[Flatten[data, 2]], First], {1}]
        ]
       ] // Prepend[#, {Rank, Entries}] &, Alignment -> {Left, Top}]
    ], RandomSeeding -> 1]
  ]
 ]

enter image description here

Below this line is the original version of this answer.


We will first generate all the random numbers that are needed for the matrices and then we are going to test the rows using Nearest.

(* dim is the dimension of the square matrix *)
(* mats stands for the number of matrices to use *)
(* n equals the number of repetitions *)
With[{dim = 3, mats = 4, n = 3},
  (* a, b are the parameters for the Weibull distribution *)
  With[{a = 2, b = 1},
    (* for reproducibility *)
    BlockRandom[
      (* generate random numbers *)
      With[{rands = RandomVariate[WeibullDistribution[a, b], mats n dim^2]},
        (* partition the random numbers to the appropriate dimensions *)
        With[{data = Partition[Partition[Partition[rands, dim, dim], dim], mats]},
          (* first apply Nearest on the rows of each matrix and then sort the output *)
          Apply[
            (* ...then *) 
            Sort@MapIndexed[{First[#1], Row[{Row, , First[#2]}]} &, {##}] &, 
            (* first *)  
            Apply[Nearest[{##}, RandomVariate[WeibullDistribution[a, b]]] &, data, {3}], {2}]]],RandomSeeding->1234659]]]

If we evaluate the code block above, we should get

{{{{1.15798, Row[{Row,  , 3}]}, {1.21961, Row[{Row,  , 1}]}, {1.42817,
Row[{Row,  , 2}]}}, {{0.469189, Row[{Row,  , 2}]}, {0.650485, 
Row[{Row,  , 3}]}, {0.848214, Row[{Row,  , 1}]}}, {{0.507585, 
Row[{Row,  , 1}]}, {0.585714, Row[{Row,  , 2}]}, {0.93049, 
Row[{Row,  , 3}]}}, {{0.507753, Row[{Row,  , 2}]}, {0.733691, 
Row[{Row,  , 1}]}, {1.27576, Row[{Row,  , 3}]}}}, {{{0.465733, 
Row[{Row,  , 1}]}, {0.561231, Row[{Row,  , 3}]}, {1.16744, 
Row[{Row,  , 2}]}}, {{0.498253, Row[{Row,  , 3}]}, {0.522801, 
Row[{Row,  , 1}]}, {1.18593, Row[{Row,  , 2}]}}, {{0.59206, 
Row[{Row,  , 3}]}, {0.8312, Row[{Row,  , 1}]}, {0.923146, 
Row[{Row,  , 2}]}}, {{0.460762, Row[{Row,  , 2}]}, {0.745601, 
Row[{Row,  , 3}]}, {0.753253, Row[{Row,  , 1}]}}}, {{{0.377382, 
Row[{Row,  , 2}]}, {0.485119, Row[{Row,  , 3}]}, {0.704786, 
Row[{Row,  , 1}]}}, {{0.379037, Row[{Row,  , 2}]}, {0.741862, 
Row[{Row,  , 3}]}, {0.809665, Row[{Row,  , 1}]}}, {{0.998331, 
Row[{Row,  , 2}]}, {1.07737, Row[{Row,  , 3}]}, {1.29412, 
Row[{Row,  , 1}]}}, {{0.589772, Row[{Row,  , 1}]}, {0.616004, 
Row[{Row,  , 2}]}, {1.25385, Row[{Row,  , 3}]}}}}

Please note that the Row[{Row,,#}] entries are there to designate the original row. For example, in the last row above, the nearest entry of the first row is the smallest, followed by the nearest entry of the second row and finally that is followed by the nearest entry in the third row.

$\endgroup$
0
$\begingroup$

My try is here: I want the first, second and third ranked values selected in each row. As I have 36 rows, so finally I want 36 observations with their ranked. I proceed as (*Generate 3*3 four time and repeat it three times a matrix follows Weibull Distribution*)

dist[a_, b_] = WeibullDistribution[a, b];
data = RandomVariate[dist[2, 1], {3, 4, 3, 3}];

(Next select nearest value of each row as compare to random number)

    data1 = Flatten[
  Table[Table[
    Table[Nearest[data[[k, j, i]], RandomVariate[dist[2, 1]]], {i, 1, 
      3}], {j, 1, 4}], {k, 1, 3}]];

(Next separate the each ranked observation in data)

    data2 = Flatten[
  Table[Table[
    Table[RankedMin[data[[k, i, j]], 1], {j, 1, 3}], {i, 1, 4}], {k, 
    1, 3}]];
data3 = Flatten[
  Table[Table[
    Table[RankedMin[data[[k, i, j]], 2], {j, 1, 3}], {i, 1, 4}], {k, 
    1, 3}]];
data4 = Flatten[
  Table[Table[
    Table[RankedMin[data[[k, i, j]], 3], {j, 1, 3}], {i, 1, 4}], {k, 
    1, 3}]];

(Now compare each ranked observation with the selected observation(with nearest command))

rmin = Intersection[data1, data2]
rmedian = Intersection[data1, data3]
rmax = Intersection[data1, data4]

(Sum of length size should be 36)

Length[rmin] + Length[rmedian] + Length[rmax]

Thats it. But next I need more general code for any size, Updated versions are welcome.

$\endgroup$
3
  • $\begingroup$ thank you for the update; technically it should have been appended to the question as a clarification of what you are trying to achieve-unless you actually intended to answer your own question. For future reference, try and use Seed or BlockRandom when dealing with random numbers; it makes the code reproducible and easier for other users to compare output/intermediate results; also, see @kglr for an idiomatic use of RandomVariate that would have made it easier not to use nested Table's $\endgroup$
    – user42582
    Commented Feb 27, 2018 at 8:08
  • $\begingroup$ although it's clearer now what you intend to do with your code, it is still unclear to me what the output of the code should be; please clarify. Finally, it would be welcomed if you could provide a hint about the expected range of inputs $\endgroup$
    – user42582
    Commented Feb 27, 2018 at 8:09
  • $\begingroup$ @user42582 Thanks for your comments, I need output in two columns. First column contain "rank" and second "observations". e.g in first row of that table we should have first rank in first column and all first ranked observation in second column of first row {1,{0.22,0.36,0.56...}} or {rank,{observations}}. And about expected range of inputs Matrix size maximum 10*10 but whole process at least repeat 10,000 times. $\endgroup$
    – SAAN
    Commented Feb 27, 2018 at 9:15

Your Answer

By clicking “Post Your Answer”, you agree to our terms of service and acknowledge you have read our privacy policy.

Not the answer you're looking for? Browse other questions tagged or ask your own question.