1
$\begingroup$

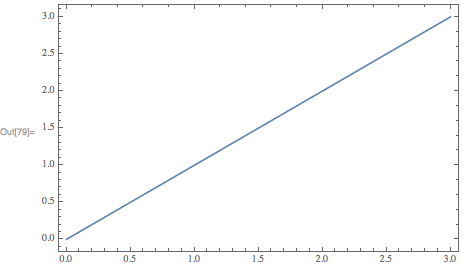
I have to publish some work and it requires to meet specific criteria for the image size and plot size. 1) the Area of the figure must be fix 2) the width of the x-axis also must be fix for any plot inside the figure. As a mere example let's consider the following plot

Plot[x, {x, 0, 3}, Axes -> False, Frame -> True, AspectRatio -> 1, 
 ImageMargins -> {{0, 130}, {0, 172}}, ImageSize -> {414, 370}]

In this case the total Figure size once exported is equal to ImageSize plus the ImageMargins values. But I don't have any control on the resulting size of the x-Axis in the plot. enter image description here
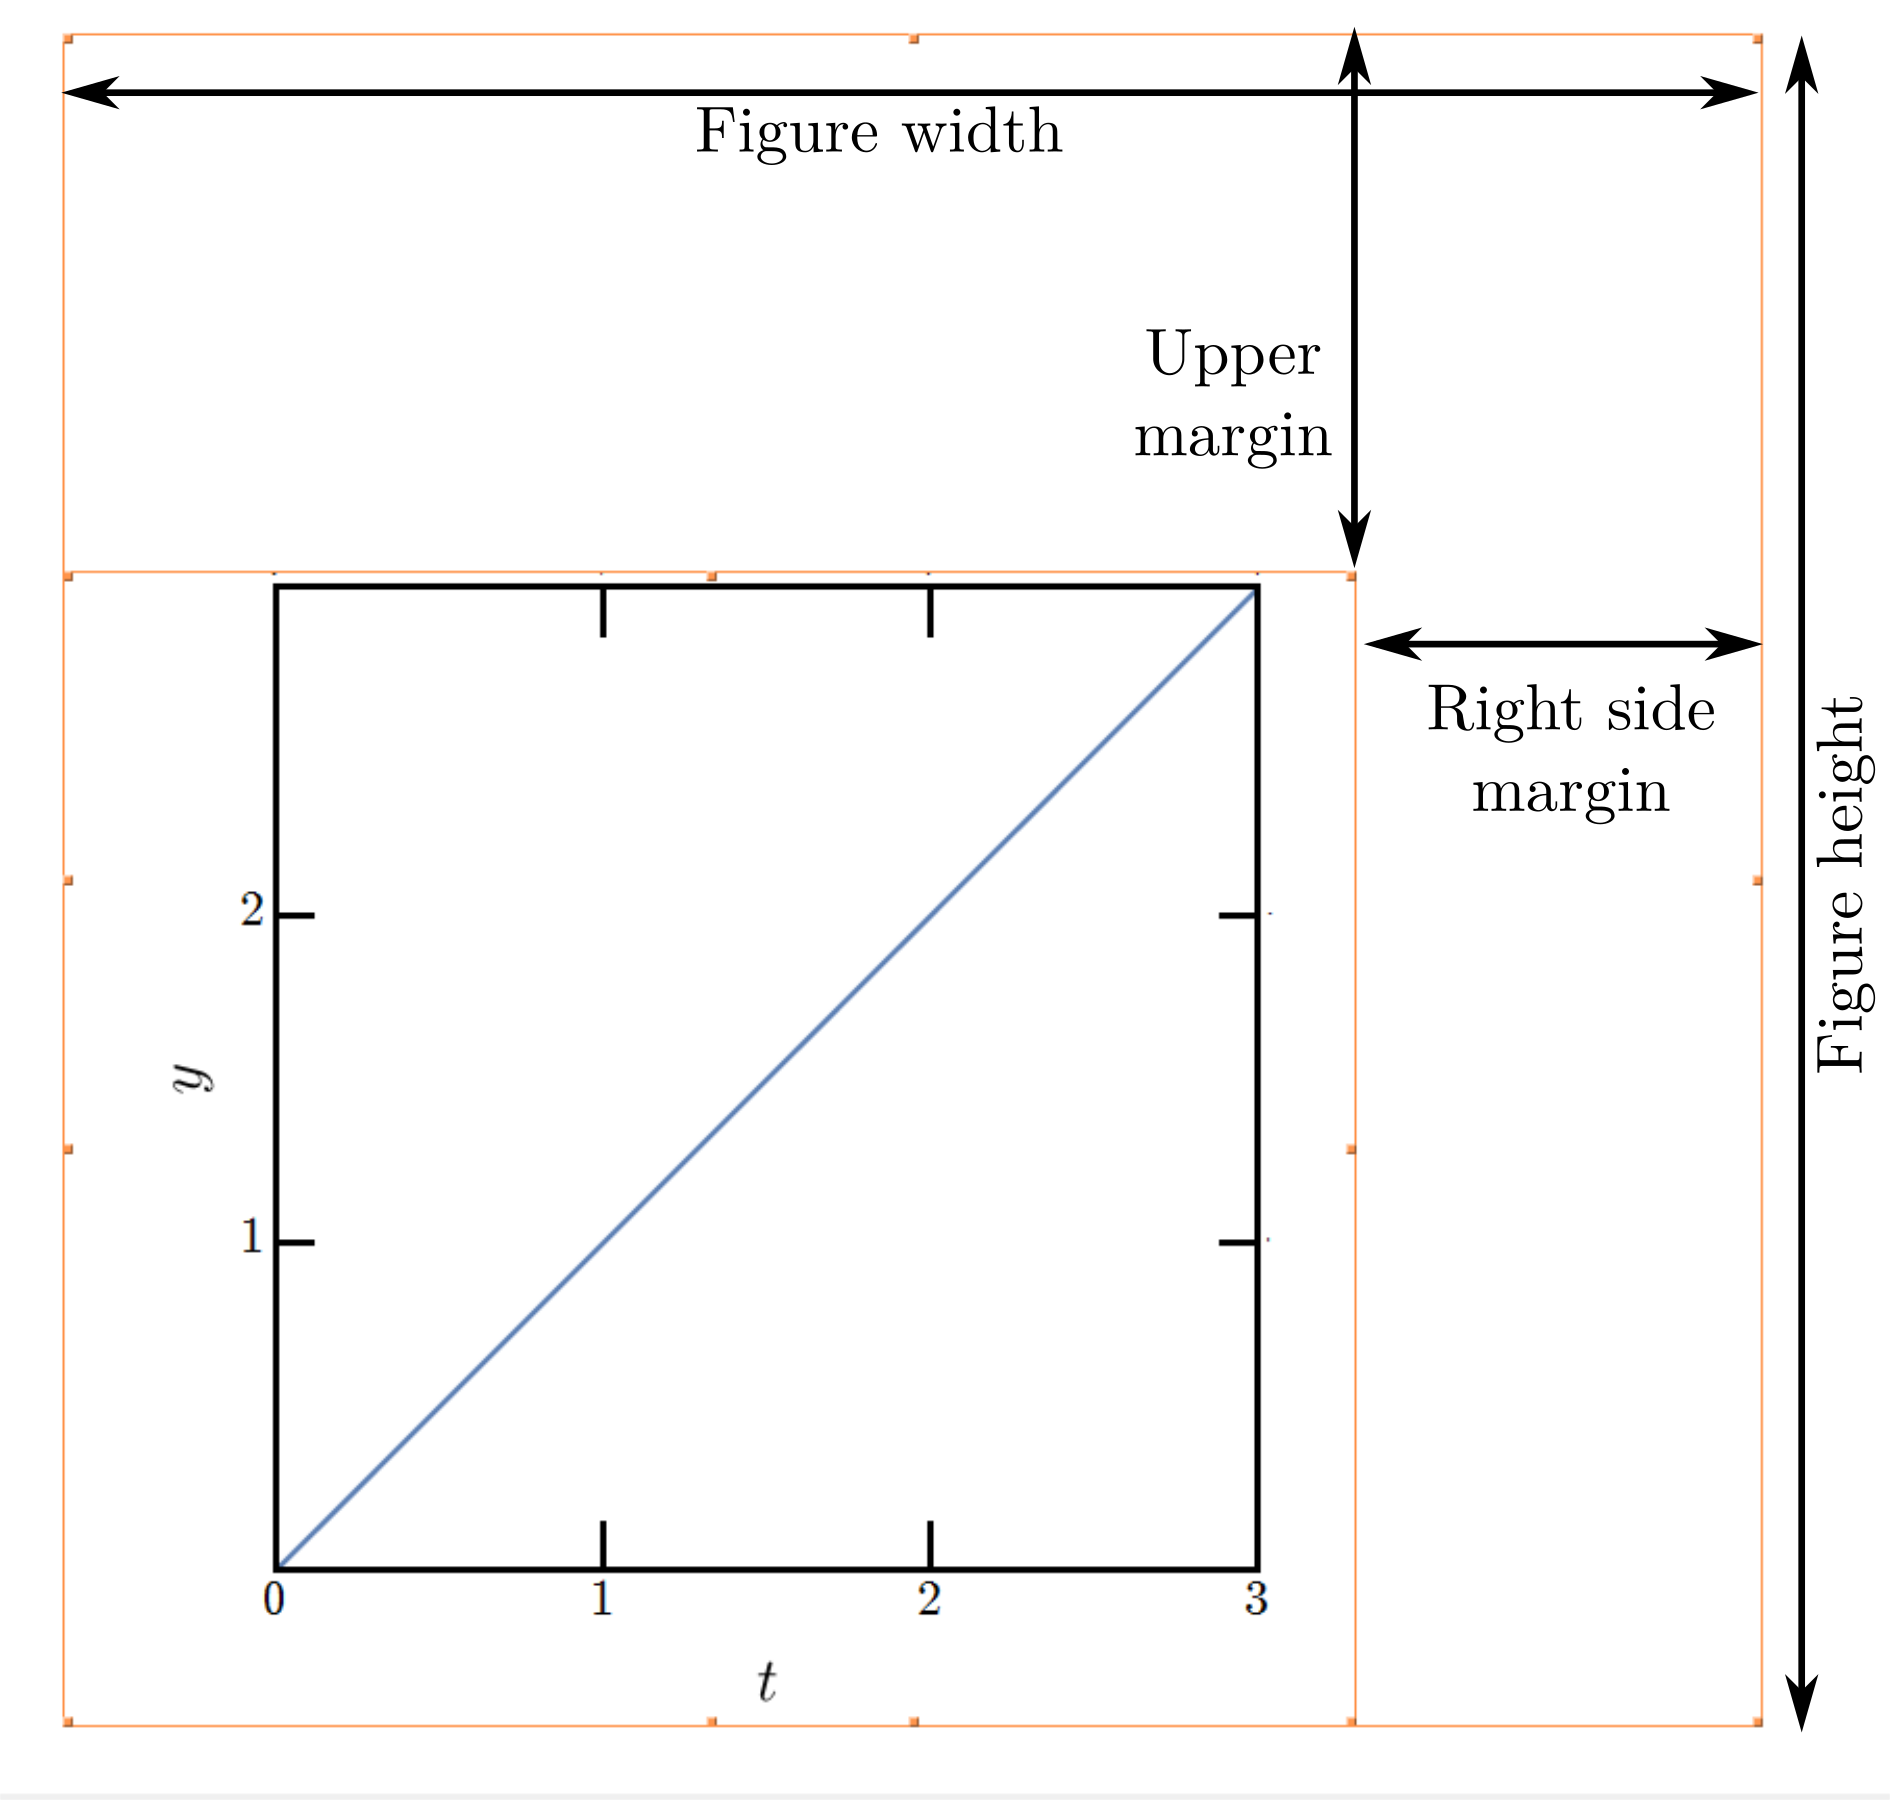
What I want to control is the X-axis size (in dpi preferable) of the plot and let mathematica calculate the padding necessary in each side regardless of any other object in the Figure like the labels or title.

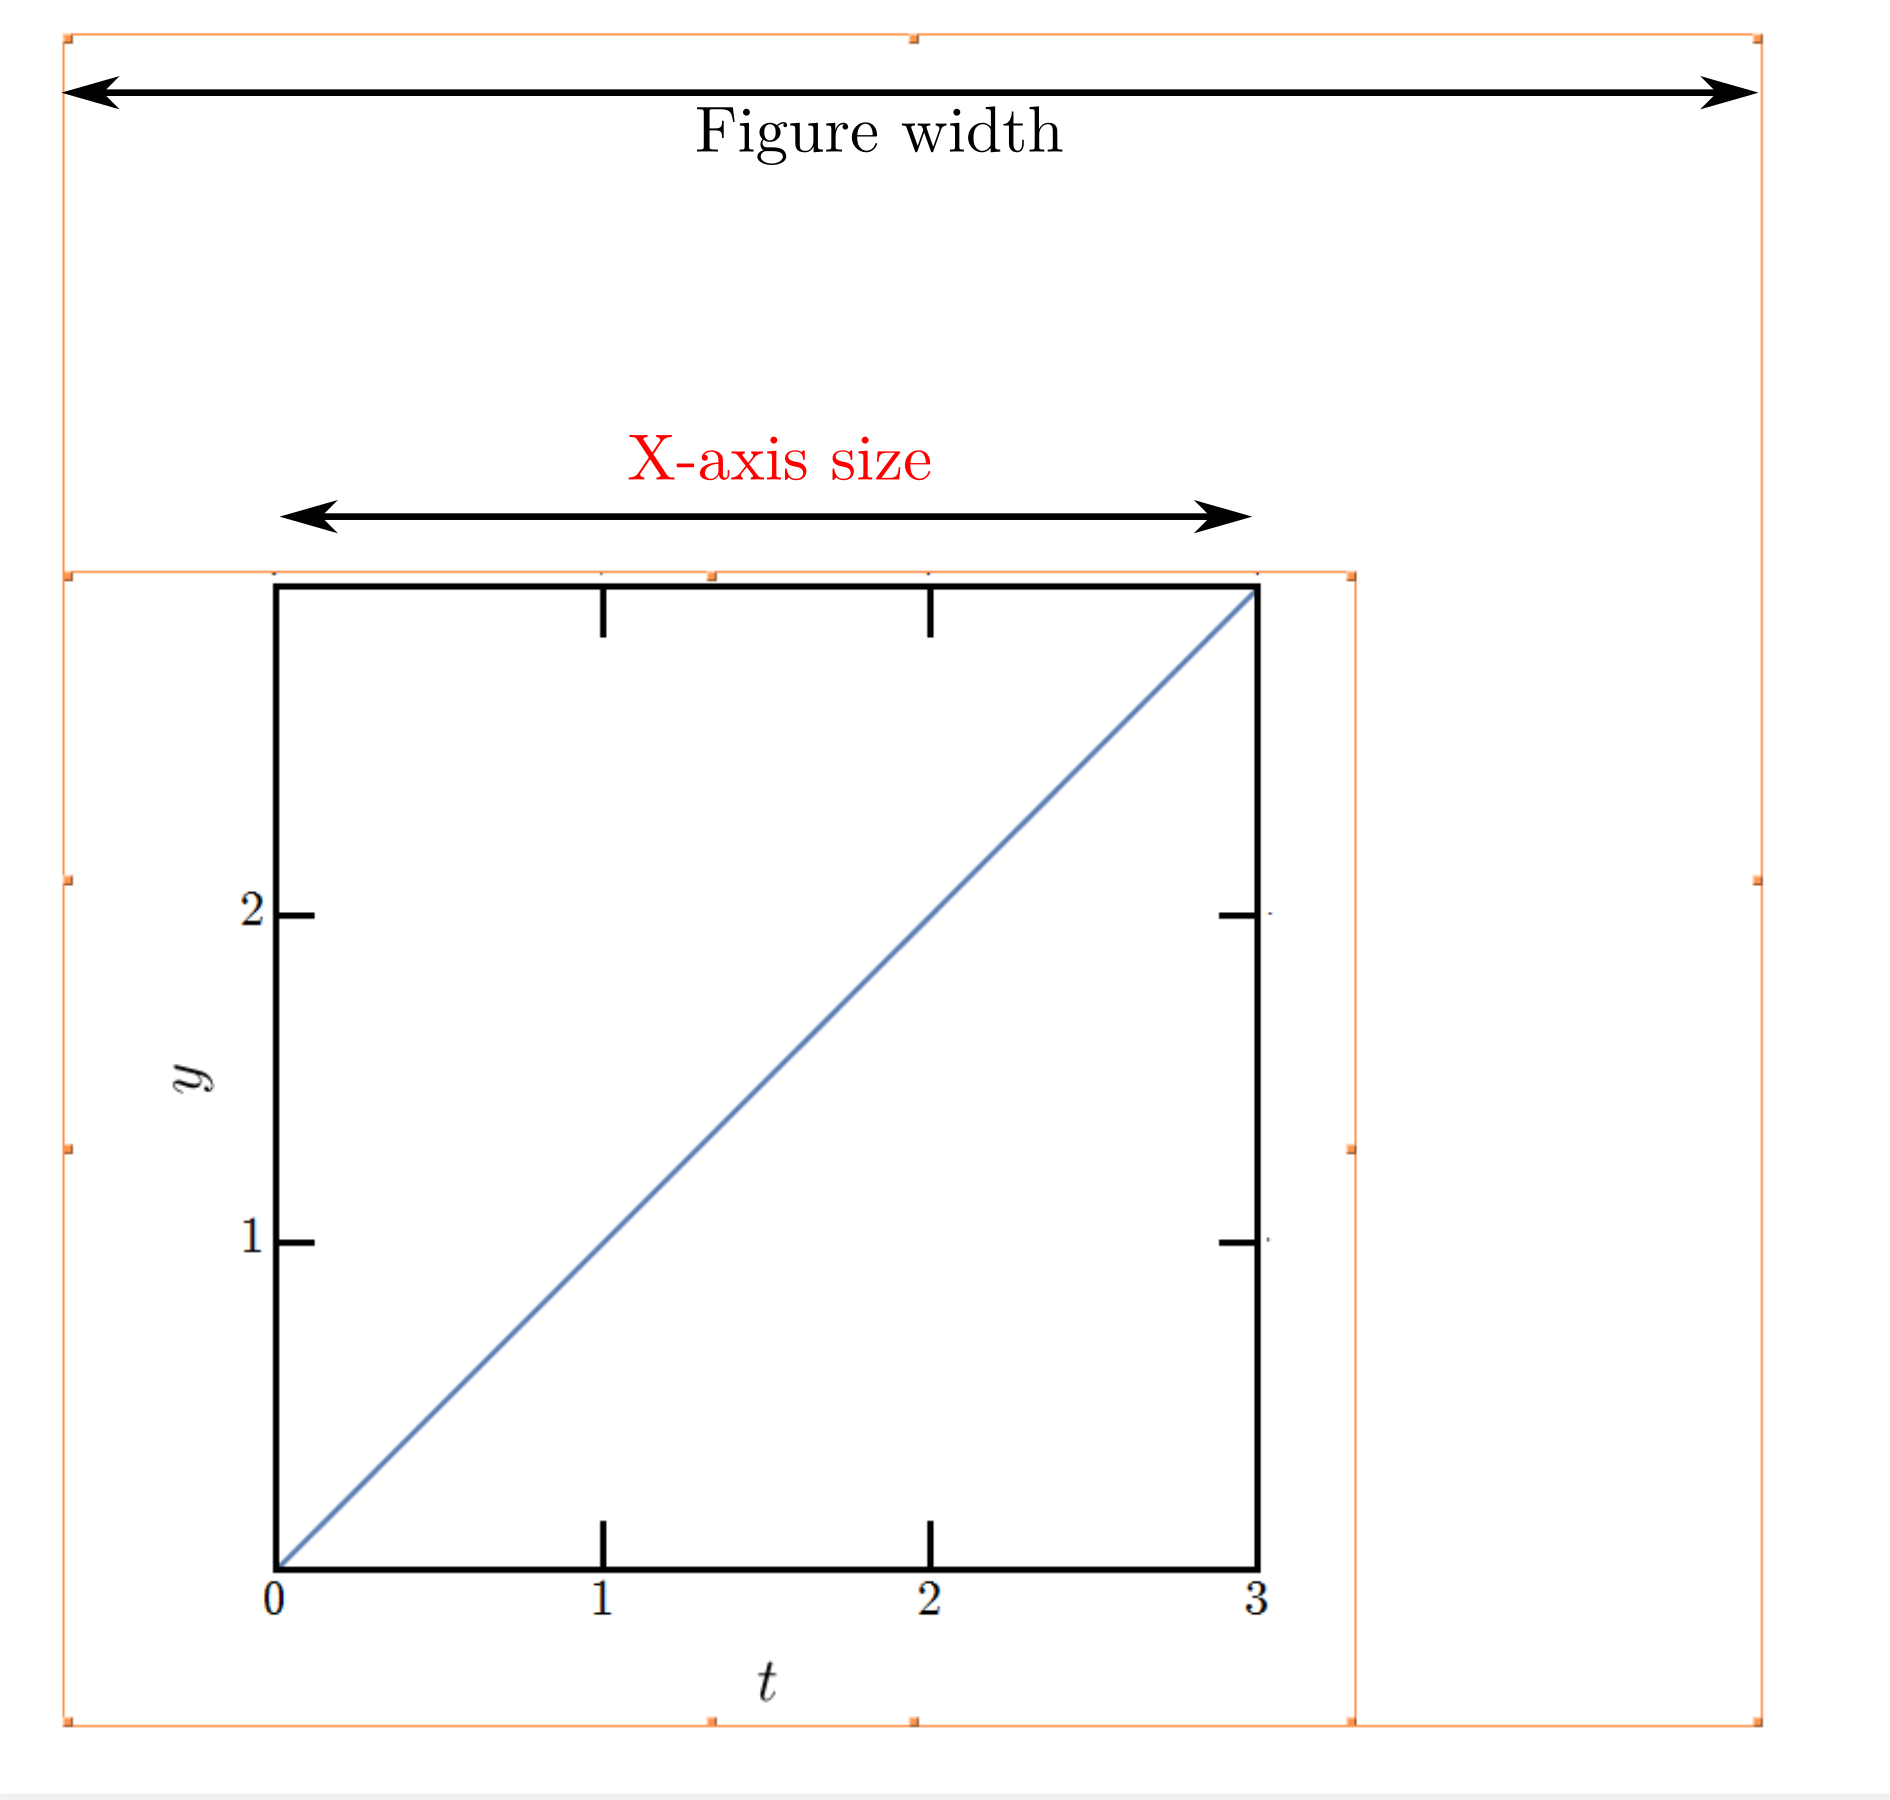
enter image description here

$\endgroup$
1
  • $\begingroup$ ImagePadding and ImageSize (and AspectRatio) are what you need to adjust and remove ImageMargins $\endgroup$ Commented Feb 19, 2018 at 5:30

1 Answer 1

4
$\begingroup$

You can use the syntax ImageSize->Automatic->size to set the plot range to a specified size. For your example:

plot = Plot[
    x,
    {x, 0, 3},
    Frame -> True,
    ImageSize -> Automatic -> 400
]

enter image description here

You can use my GraphicsInformation function to verify the plot range size. Install with:

PacletInstall[
    "GraphicsInformation",
    "Site" -> "http://raw.githubusercontent.com/carlwoll/GraphicsInformation/master"
];

Then load it:

<<GraphicsInformation`

Now, let's check:

"PlotRangeSize" /. GraphicsInformation[plot]

{400., 247.214}

$\endgroup$
4
  • $\begingroup$ This function gives me the values in pt , but I want to set that value $\endgroup$
    – Jared Lo
    Commented Feb 20, 2018 at 1:21
  • $\begingroup$ @JaredLo To set the value, just use ImageSize->Automatic->size, as I said in my answer. The function GraphicsInformation was just used to show you that my answer does what I claim it does. $\endgroup$
    – Carl Woll
    Commented Feb 20, 2018 at 1:25
  • $\begingroup$ after try "plot = Plot[x, {x, 0, 3}, Frame -> True, ImageSize -> Automatic -> 400] " and "PlotRangeSize" /. GraphicsInformation[plot] I got a completely different value {600., 370.82}. I'm using mathematica 11.1 $\endgroup$
    – Jared Lo
    Commented Feb 20, 2018 at 2:31
  • $\begingroup$ @JaredLo That's very strange. Does the plot look like it's 400 pixels or 600 pixels? Are you changing the Magnification at all? $\endgroup$
    – Carl Woll
    Commented Feb 20, 2018 at 2:42

Your Answer

By clicking “Post Your Answer”, you agree to our terms of service and acknowledge you have read our privacy policy.

Not the answer you're looking for? Browse other questions tagged or ask your own question.