14
$\begingroup$

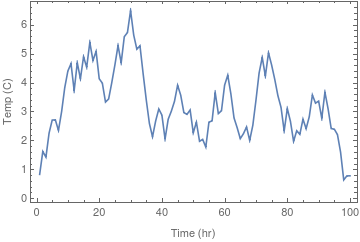
Consider the following data indicating temperature in degree Celcius vs time in hours:

SeedRandom[95];
TEMPvsTIME = {Range[100], 
    Accumulate[RandomReal[{-1, 1}, 100]]}\[Transpose];


ListPlot[TEMPvsTIME, Joined -> True, Frame -> True, 
 FrameLabel -> {"Time (hr)", "Temp (C)"}]

enter image description here

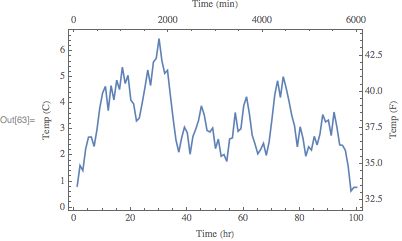
How can I include another horizontal and vertical axis on the top and on the right, scaled for the same data/plot to show time in minutes and temperature in Fahrenheit respectively? Unlike this question, I am not plotting 2 datasets and the only way that comes to my mind is to create an empty dataset and use TwoAxisPlot. Is there a better way of doing this?

$\endgroup$

3 Answers 3

14
$\begingroup$

Charting`FindTicks

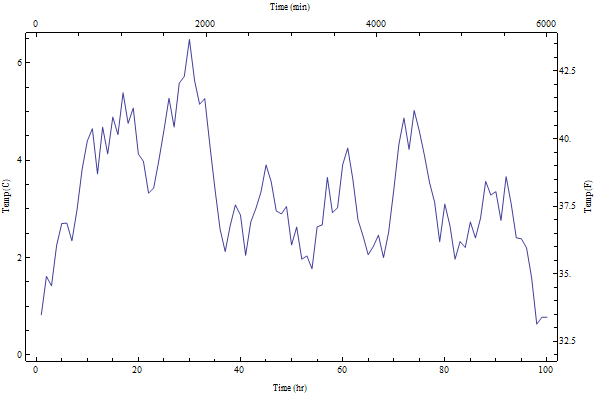
You can also use Charting`FindTicks to get the linearly scaled ticks:

ListPlot[TEMPvsTIME, Joined -> True, Frame -> True,
 FrameTicks -> {{Automatic,   Charting`FindTicks[{0, 100}, {32, 212}]}, 
   {Automatic,  Charting`FindTicks[{0, 1}, {0, 60}]}},
 FrameLabel -> {{"Temp (C)", "Temp (F)"}, {"Time (hr)", "Time (min)"}}]
enter image description here

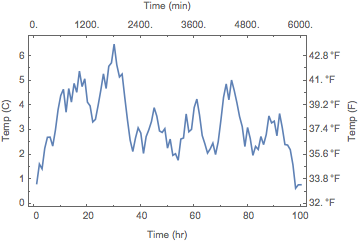
Update: If you wish to have the same positions but different labels for axes pairs (as suggested by Jose in a comment) you can do

cft = Charting`FindTicks[{0, 1}, {0, 1}];
ListPlot[TEMPvsTIME, Joined -> True, Frame -> True,
 FrameTicks -> {{cft,
    Replace[cft[##], {x_?NumericQ, Except[""], z___} :> {x,  32 + 9/5 x, z}, 1] &},
  {cft,  Replace[cft[##], {x_?NumericQ, Except[""], z___} :> {x, Floor[60  x], z}, 1] &}},
 FrameLabel -> {{"Temp (C)", "Temp (F)"}, {"Time (hr)",  "Time (min)"}}]
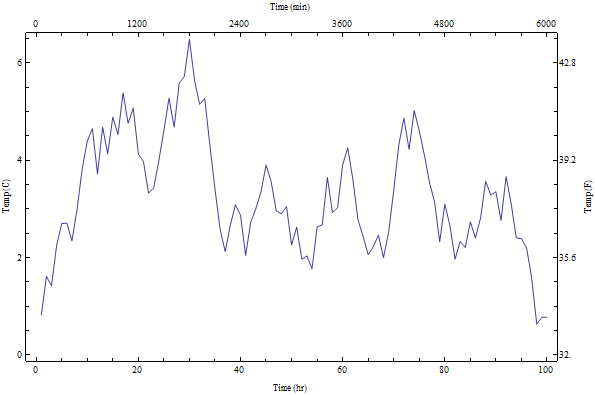
enter image description here

Update 2: To add GridLines (thanks @JoseAntonioDiazNavas for the suggestion) and quantity units in temperature labels (as in egwene sedai's answer):

ListPlot[TEMPvsTIME, Joined -> True, Frame -> True, 
  FrameTicks -> {{Replace[cft[##], {x_?NumericQ, Except[""], z___} :> 
     {x, Quantity[x, "Celsius"], z}, 1] &, 
    Replace[cft[##], {x_?NumericQ, Except[""], z___} :>
     {x,  UnitConvert[Quantity[x, "Celsius"], "Fahrenheit"], z},  1] &}, 
   {cft, Replace[cft[##], {x_?NumericQ, Except[""], z___} :> {x, Floor[60 x], z}, 1] &}}, 
   FrameLabel -> {{"Temp (C)", "Temp (F)"}, {"Time (hr)",  "Time (min)"}}, 
  GridLines -> {Automatic, (DeleteCases[cft[##], {_, "", ___}][[All, 1]] &)}]
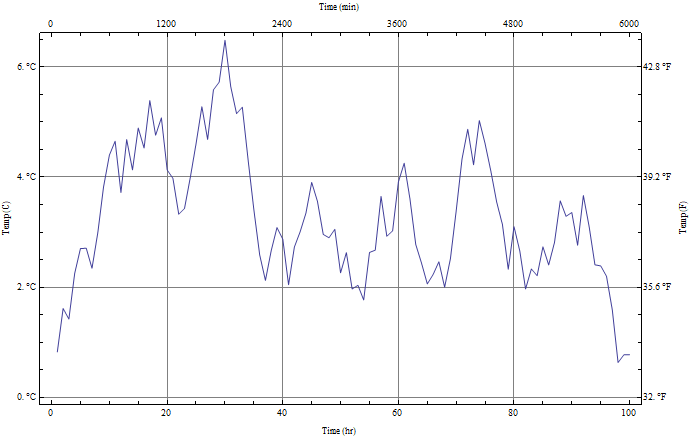
enter image description here

$\endgroup$
3
  • 1
    $\begingroup$ Although a good solution, as well as that of @CarlWoll, I am more in favor in plotting axes in which corresponding ticks are aligned to better see how values are related. $\endgroup$ Commented Feb 13, 2018 at 20:40
  • $\begingroup$ @JoséAntonioDíazNavas, very good point. Updated with a version that changes the labels only. $\endgroup$
    – kglr
    Commented Feb 13, 2018 at 21:04
  • 1
    $\begingroup$ Nice and useful, particularly when someone wants to add GridLines +1 $\endgroup$ Commented Feb 13, 2018 at 22:17
12
$\begingroup$

You can use FrameTicks to specify the kind of ticks you want. I like using Charting`ScaledTicks to specify ticks, so the following would be my approach:

ListPlot[
    TEMPvsTIME,
    Joined->True,
    Frame->True,
    FrameTicks->{
        {Automatic,Charting`ScaledTicks[{5/9(#-32)&,9/5#+32&}]},
        {Automatic,Charting`ScaledTicks["Linear",{#/60&,# 60&},"Nice"]}
    },
    FrameLabel->{{"Temp (C)", "Temp (F)"},{"Time (hr)", "Time (min)"}}
]

enter image description here

$\endgroup$
1
  • $\begingroup$ Can we get ScaledTicks documented and added to the System functions? $\endgroup$ Commented Feb 14, 2018 at 1:37
11
$\begingroup$

You may use the SciDraw Package:

Needs["SciDraw`"];

SeedRandom[95];
TEMPvsTIME = {Range[100], 
    Accumulate[RandomReal[{-1, 1}, 100]]}\[Transpose];


ListPlot[TEMPvsTIME, Joined -> True, Frame -> True, 
 FrameLabel -> {{"Temp (C)", "Temp (F)"}, {"Time (hr)", 
    "Time (min)"}}, 
 FrameTicks -> {{LinTicks[0, 6, 1, 2], 
    LinTicks[0, 6, 1, 2, 
     TickLabelFunction -> (UnitConvert[Quantity[#, "Celsius"], 
         "Fahrenheit"] &)]}, {LinTicks[0, 100, 20, 2], 
    LinTicks[0, 100, 20, 2, TickLabelFunction -> (#*60 &)]}}]

enter image description here

$\endgroup$
2
  • $\begingroup$ note: Carl Woll's answer works wonderfully and does not require 3rd party packages; here you need to load the extra package, but it is better documented than Charting `ScaledTicks $\endgroup$ Commented Feb 13, 2018 at 20:30
  • $\begingroup$ seai, I did not know about SciDraw. I'll start using it. Thanks! $\endgroup$
    – Miladiouss
    Commented Feb 14, 2018 at 4:36

Your Answer

By clicking “Post Your Answer”, you agree to our terms of service and acknowledge you have read our privacy policy.

Not the answer you're looking for? Browse other questions tagged or ask your own question.