3
$\begingroup$

I have 2 of list data

CurveA = {{140.796, 31.3888}, {140.555, 31.5343}, {140.314, 31.6829},  
 {140.076, 31.8344}, {139.839, 31.9889}, {139.604, 32.1464},
 {139.37, 32.3069}, {139.138, 32.4704}, {138.908, 32.6369}, 
 {138.68, 32.8065}, {138.452, 32.9791}, {138.227, 33.1547},  
 {138.003, 33.3334}, {137.781, 33.5152}, {137.56, 33.7}, 
 {137.341, 33.8879}, {137.123, 34.0789}, {136.907, 34.2729},
 {136.692, 34.4701}, {136.479, 34.6704}, {136.267, 34.8738}, {136.057, 35.0804}};

CurveB = {{140.492, 31.5563}, {139.939, 31.8567}, {139.38, 32.1475}, 
 {138.816, 32.4285}, {138.248, 32.6996}, {137.675, 32.9607}, 
 {137.098, 33.2118}, {136.516, 33.4528}};

If I want to know the index or position of a pairs data (CurveA and CurveB) which have distance of 1 mm, how to do that? Here is the illustration:

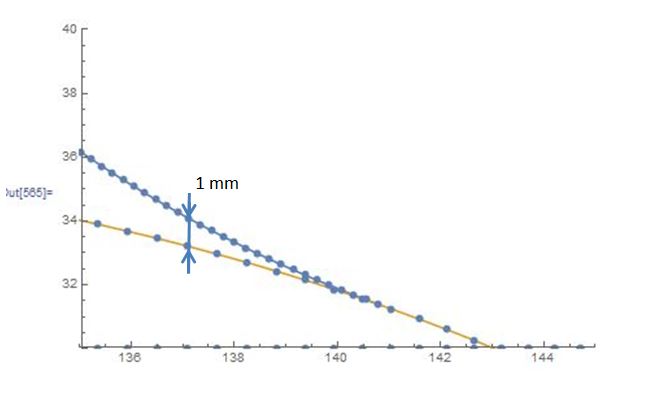
enter image description here

$\endgroup$
1
  • $\begingroup$ DistanceMatrix[]? $\endgroup$ Commented Jan 26, 2018 at 2:38

2 Answers 2

4
$\begingroup$

One approach is to interpolate to find functions that represent the data and then find a root of that function. cA is the interpolation of CurveA, cB is the interpolation of CurveB, and you are looking for the value at which they are 1 apart:

cA = Interpolation[CurveA];
cB = Interpolation[CurveB]; 
FindRoot[cA[t] - cB[t] == 1, {t, 136}]
{t -> 136.868}
$\endgroup$
3
$\begingroup$
iFA = Interpolation[CurveA];
iFB = Interpolation[CurveB];
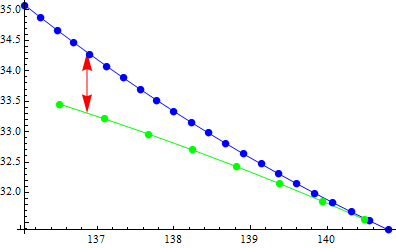
Quiet @ ListPlot[{CurveA, CurveB, CurveA, CurveB},  
  Joined -> {True, True, False, False}, PlotStyle -> {Blue, Green}, 
  BaseStyle -> PointSize[.02], 
  MeshStyle -> ({Red, Arrowheads[{-.05, .05}], Arrow@@#}&), 
  MeshFunctions -> {iFA[#] - iFB[#] &}, Mesh -> {{1}}]

enter image description here

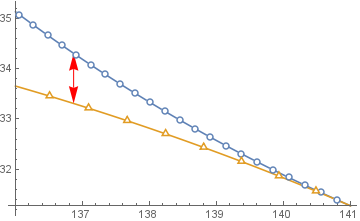
Update: The MeshStyle trick above does not work with ListLinePlot in version 11.2. It does work with Plot, so, in version 11.2, you can do

Quiet@Plot[{iFA[t],iFB[t]}, {t, 156, 141},
  MeshStyle -> ({Red, Arrowheads[{-.05, .05}], Arrow @@ #} &),
  MeshFunctions -> {iFA[#] - iFB[#] &}, Mesh -> {{1}}, 
  Epilog-> {ListPlot[{CurveA, CurveB}, PlotTheme -> "OpenMarkers"][[1]]}]

enter image description here

$\endgroup$

Your Answer

By clicking “Post Your Answer”, you agree to our terms of service and acknowledge you have read our privacy policy.

Not the answer you're looking for? Browse other questions tagged or ask your own question.