2
$\begingroup$

Consider, I have a disk colored in "LAB" color space. When I convert the graphics into image object it is by default getting converted into "RGB" color space.

ImageColorSpace@Image[Graphics[{LABColor[0.4, 0.6, 0.8], Disk[]}]]

"RGB"

If I now convert it back to "LAB" color space,

ColorConvert[
 Image[Graphics[{LABColor[0.4, 0.6, 0.8], Disk[]}]], "LAB"]

The color value that I get is

{0.40047, 0.603491, 0.548764}

(* Sorry, this was a mistake on my part. Duely corrected after following the answer by Theelepel *)

How can I get the original color value in the "LAB" color space?

Updated question: If the original color value is not known and I am given only with the final Graphics object showing RGB color value, How can I retrieve the original LAB color value?

Updation 2: Following the answer of corey979 to this question, I can see

Table[data = 
  ImageData[
    ColorConvert[Graphics[{LABColor[0.4, 0.6, b], Disk[]}], 
     "LAB"]][[100, 100]];
 N@Rationalize[#, 1/255] &@data, {b, 0, 1, 0.1}]

{{0.4, 0.6, 0.}, {0.4, 0.6, 0.105263}, {0.4, 0.6, 0.2}, {0.4, 0.6, 0.3}, {0.4, 0.6, 0.407407}, {0.4, 0.6, 0.5}, {0.4, 0.6, 0.545455}, {0.4, 0.6, 0.545455}, {0.4, 0.6, 0.545455}, {0.4, 0.6, 0.545455}, {0.4, 0.6, 0.545455}}

Clearly, up to 0.5 for the value of b this works fine except for 0.1 and 0.4. However, from 0.6 onwards the b value remains fixed at 0.545455.

(1) Is it not possible to resolve this issue? (2) Can there be any way in the Graphics option to prevent it from automatic conversion to RGB?

$\endgroup$

2 Answers 2

2
$\begingroup$

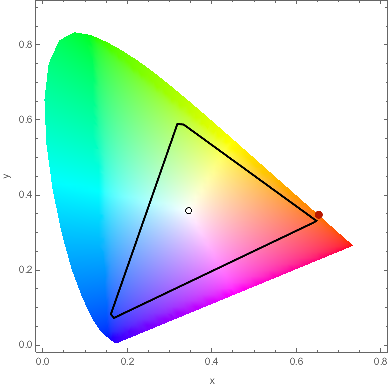
The main issue with your color is that it is not representable in the RGB space. You can see this by performing a round tripping conversion

c = LABColor[0.4, 0.6, 0.8];
List @@ ColorConvert[ColorConvert[c, "RGB"], "LAB"]

(* => {0.401061, 0.602608, 0.549039} *)

Or by looking at the color in the chromaticity plot

ChromaticityPlot[
    {c, "RGB"}, 
    BoundaryStyle -> {{Thick, Black}}, PlotStyle -> PointSize[.05]
]

gamut 2D

You can get a better idea comparing the color LAB coordinates with the RGB gamut in LAB

gamut 3D

$\endgroup$
0
$\begingroup$

First of all, the main reason you get such a different color, is that you added an alpha value of 0.9 to the second line.

color = LABColor[0.4, 0.6, 0.8];
graphic = ColorConvert[Graphics[{LABColor[0.4, 0.6, 0.8], Disk[]}], "LAB"];
PixelValue[graphic, {100, 100}]

Returns {0.40047, 0.603491, 0.548764}.

The underlying Graphics object is itself in 8-bit RGB color space. By converting to RGB and back, some precision is lost, and the channels are truncated to fit in the RGB range. This truncation is what happened to the third channel. I don't think there is a way around this. (See also Color Space issue with Graphics).

If it is important to get an Image with this exact color, perhaps you can use ColorReplace:

PixelValue[ColorReplace[graphic, color -> color], {100,100}]

Is {0.4, 0.6, 0.8}.

$\endgroup$

Your Answer

By clicking “Post Your Answer”, you agree to our terms of service and acknowledge you have read our privacy policy.

Not the answer you're looking for? Browse other questions tagged or ask your own question.