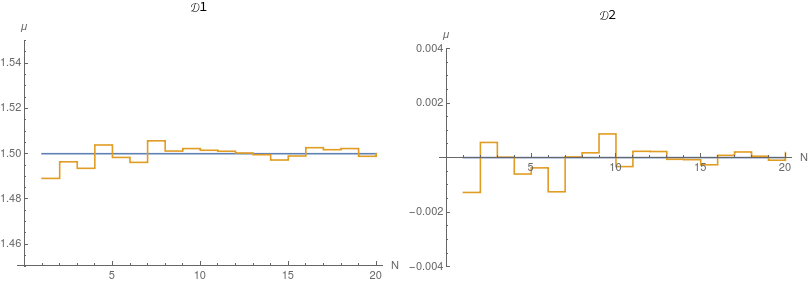
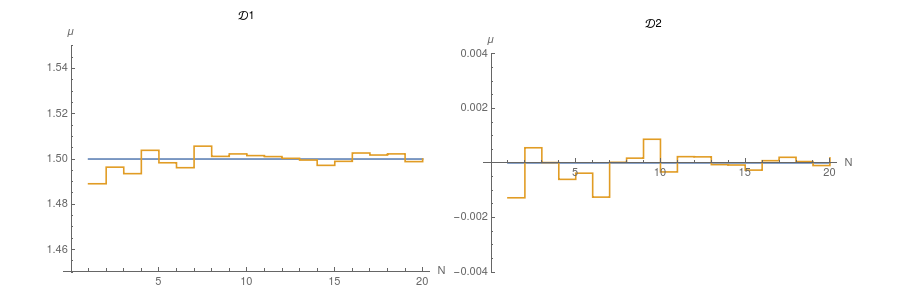
The following example data is from here.
The problem: To get the image inset into a Graphic object just large enough to hold the inset image.
The Inset technique was suggested here.
The context is that Labels are often exported rasterized and of poor quality. This is especially true in the case of 3D graphics.
The solution to these is to Graphics[Inset[yourimg]] when you export to PDF or SVG, which gives all labels etc. as vectorized.
Particularly powerful when you use MaTeX to produce publication quality graphics
meandatf1 = {1.48908, 1.49641, 1.49354, 1.50385, 1.49835, 1.49617,
1.50569, 1.50117, 1.50226, 1.50151, 1.50108, 1.50031, 1.49955,
1.49721, 1.49898, 1.50266, 1.50177, 1.50227, 1.49886, 1.50002}

meandatf2 = {-0.00127783, 0.000556012,
0.0000143709, -0.000602328, -0.000375952, -0.00125357, 0.0000228143,
0.000175103, 0.000868018, -0.0003298, 0.000230178,
0.000222689, -0.0000624273, -0.0000760139, -0.000263302,
0.0000826082, 0.000206463, 0.0000507921, -0.0000955452,
0.000184107}
genPlot[c_, dat_, ymin_, ymax_, legend_] :=
ListPlot[{Table[c, {Length[dat]}], dat}, AxesLabel -> {"N", "\[Mu]"},
PlotRange -> {Automatic, {ymin, ymax}},
PlotLegends -> Placed[legend, Above], Joined -> True, Mesh -> None,
InterpolationOrder -> 0,
 ImageSize -> 400] (*I tried also without ImageSize,see below*)

plot1 = genPlot[3/2, meandatf1, 1.45, 1.55, "\[ScriptCapitalD]1"];
plot2 = genPlot[0, meandatf2, -0.004, 0.004, "\[ScriptCapitalD]2"];

gg = Grid[{{plot1, plot2}}];
Graphics[Inset[gg, Automatic, Automatic,Scaled[1]], ImageSize -> {800, 400}]
Appreciate hints and tips.


ImageSize -> {Full, Automatic}, (orImageSize -> {800, Automatic}) andAspectRatio -> 1/3? $\endgroup$Graphics[Inset[gg], AspectRatio -> 1/3]$\endgroup$