2
$\begingroup$

I have a list of data containing emissions:

{{0, 0}, {1, 1}, {2, 4}, {3, 9}, {4, 16}, {5, 25}, {6, 36}, {7, 49},
 {8, 5}, {9, 81}, {10, 100}}

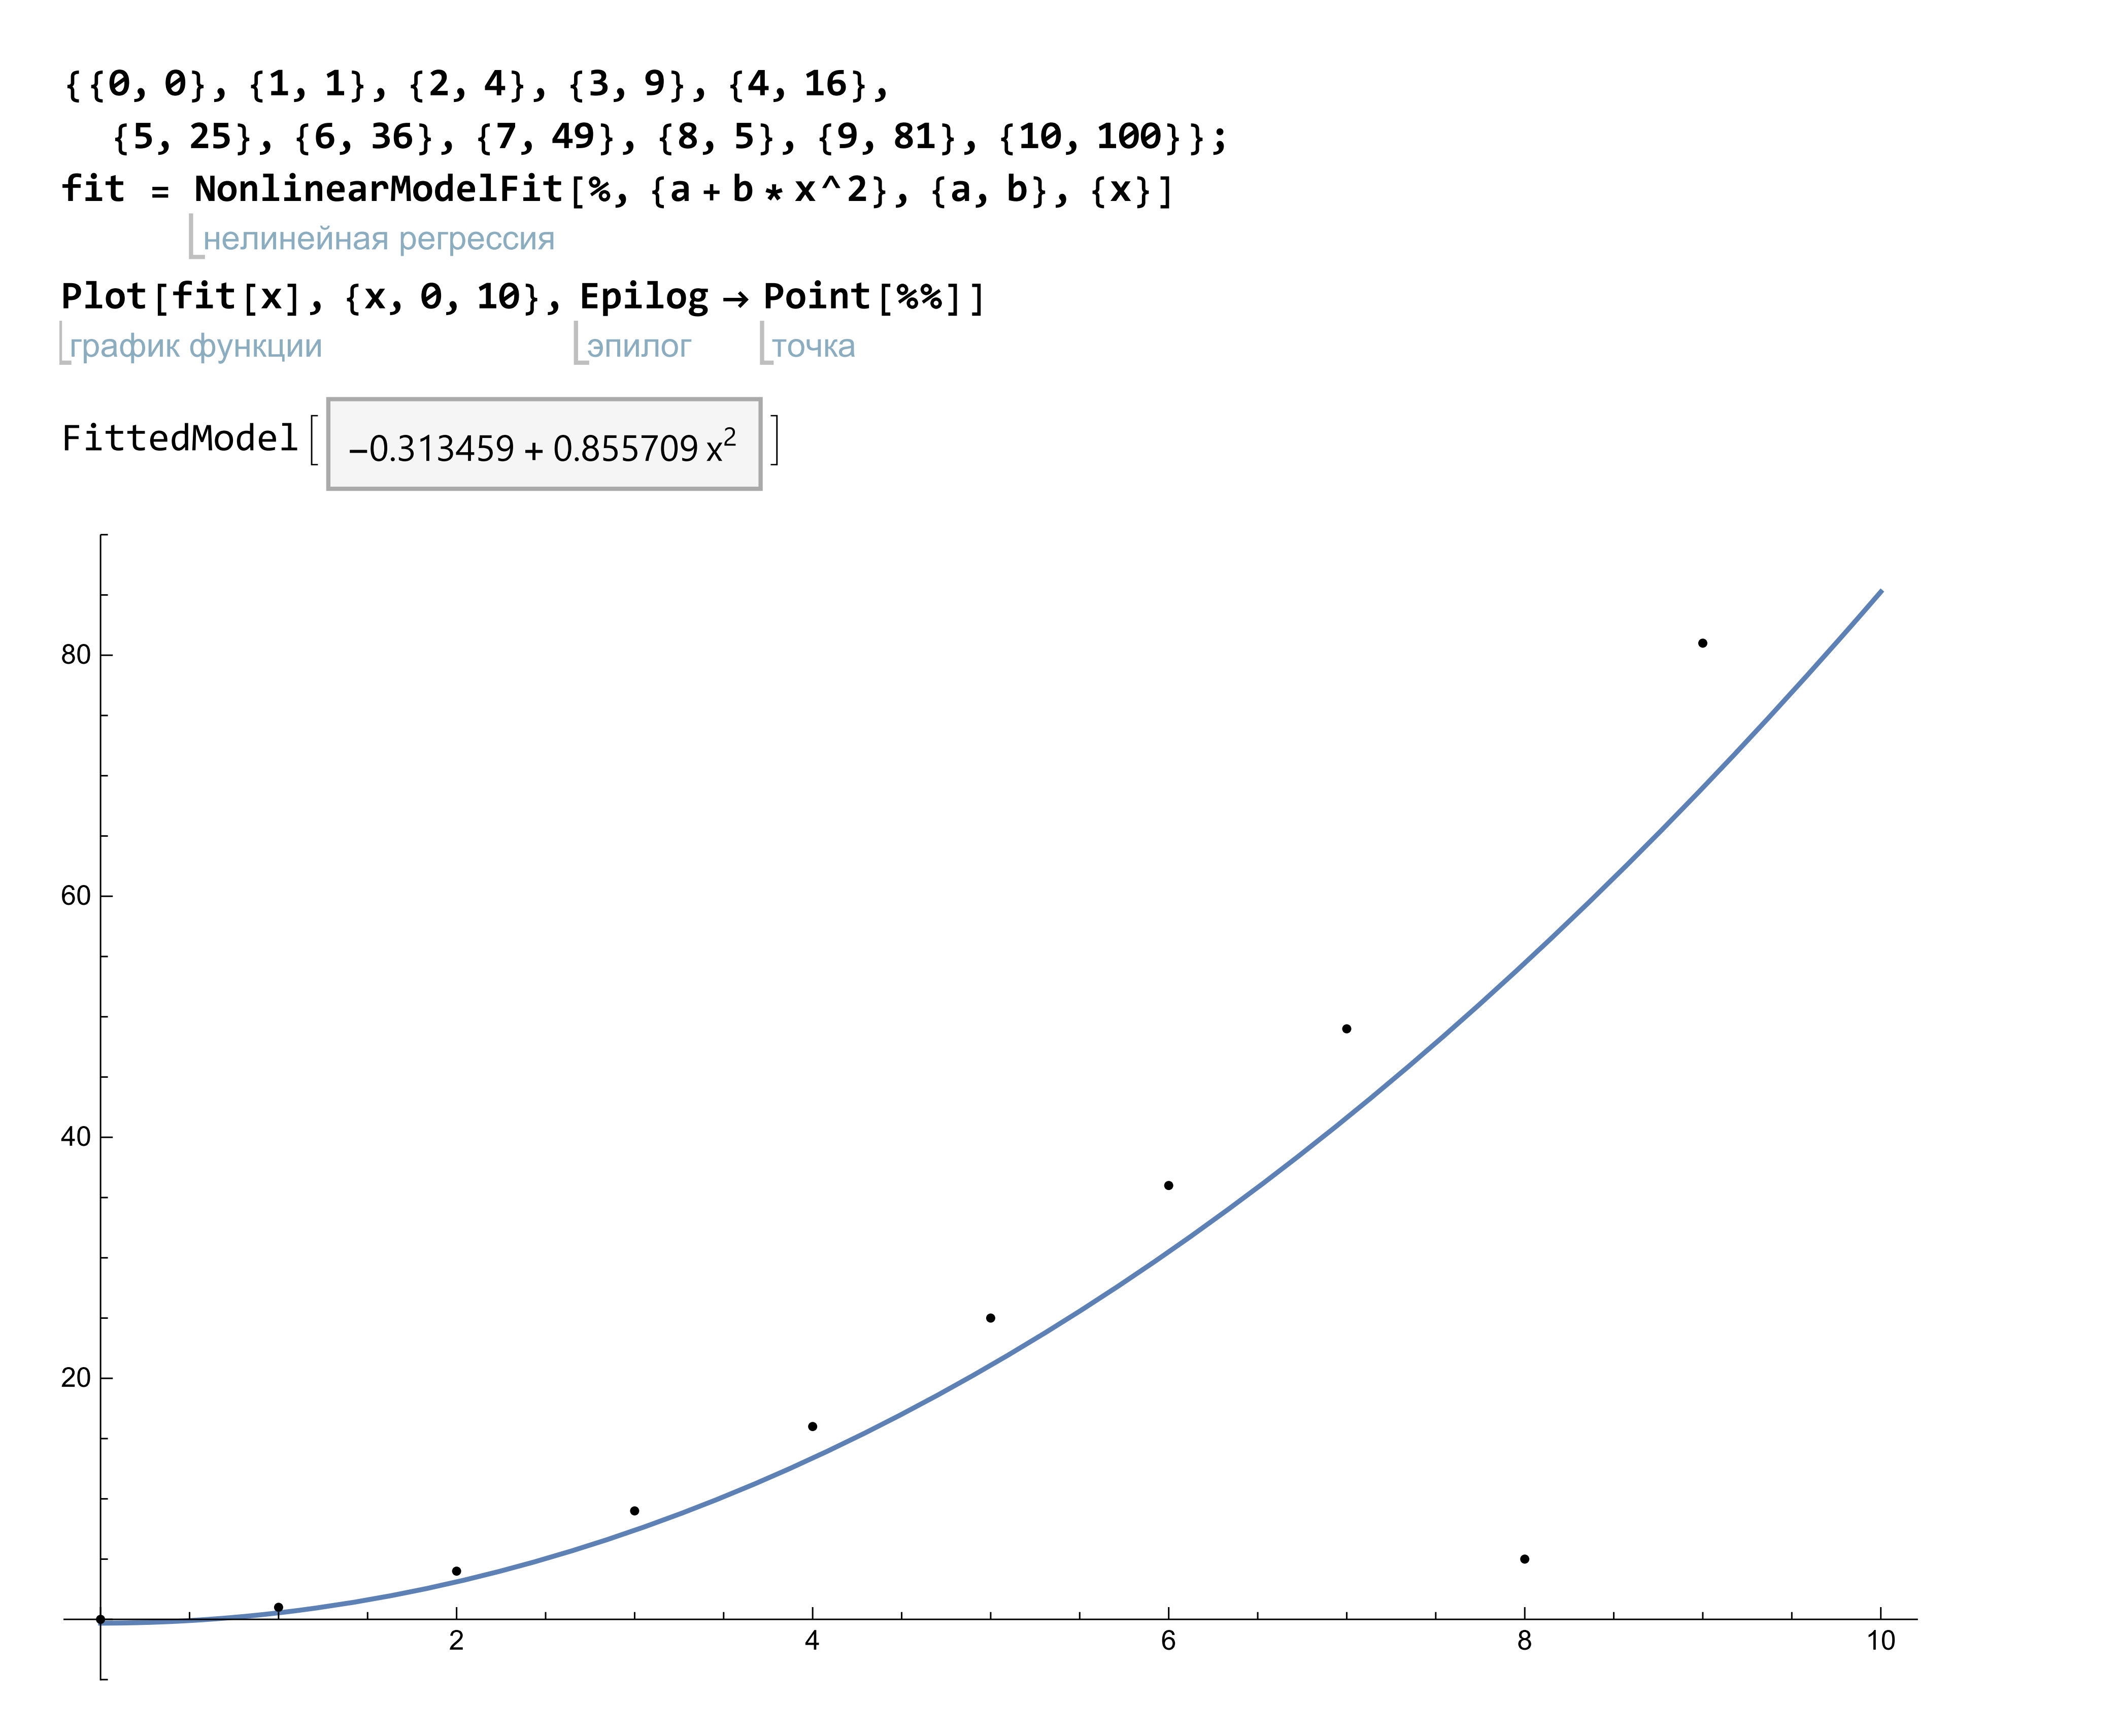
If I make a fit of these data by the least-squares method, then I get a big error:

NonlinearModelFit[%, {a + b*x^2}, {a, b}, {x}]
Plot[fit[x], {x, 0, 10}, Epilog -> Point[%%]]

plot

How do I perform robust nonlinear regression in Mathematica?

$\endgroup$
9
  • 1
    $\begingroup$ You have an outlier at x=8. Is it typo? Maybe you meant {8,64} $\endgroup$ Commented Dec 24, 2017 at 20:13
  • 1
    $\begingroup$ Use Quantile regression. $\endgroup$ Commented Dec 24, 2017 at 20:15
  • 5
    $\begingroup$ An outlier needs a reason to be other than looking like it just doesn't fit in with the others. If you have a reason (machine broke, there was an earthquake, etc.) to remove that one point (and have subjected the other points to the same scrutiny), then by all means, remove that point. But if you have no good reason to remove that single point, then with so few data points all robust regression is going to do for you is put your head in the sand. Determining why that single data point is off would seem to be a high priority rather than attempting to figure out a way to ignore it. $\endgroup$
    – JimB
    Commented Dec 24, 2017 at 23:08
  • 1
    $\begingroup$ This is a good question but I've voted to close the question because I think the "why or why not use robust regression" should be considered first and would be more appropriately addressed at stats.stackexchange.com as such methods are very data dependent (both the actual numbers in the data set and how the data was collected - although the data above seems to be not real-world data). $\endgroup$
    – JimB
    Commented Dec 24, 2017 at 23:47
  • 2
    $\begingroup$ Notice also that there is no reason to use NonlinearModelFit in this case, since the model function is linear in the parameters a and b; for this model, it is better to use LinearModelFit. $\endgroup$
    – Vito Vanin
    Commented Dec 25, 2017 at 2:51

1 Answer 1

7
$\begingroup$

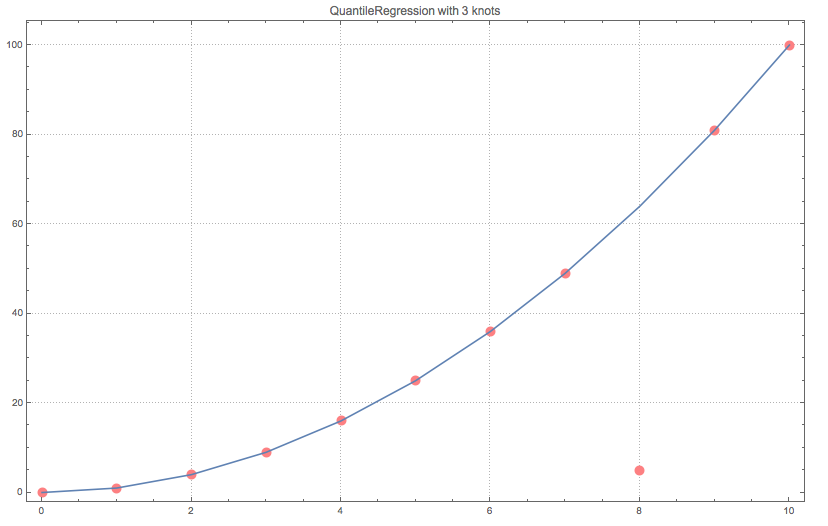
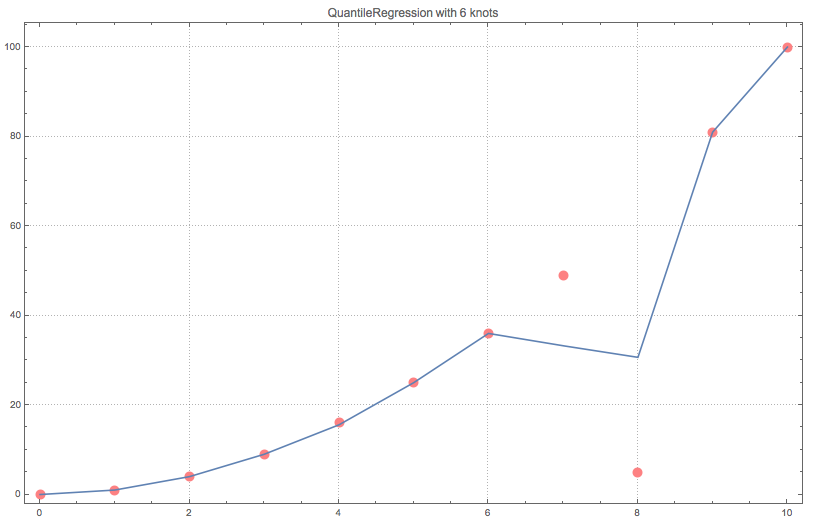
As I mentioned in a comment Quantile Regression is much more robust compared to Linear Regression when it comes to outliers in the data. See this blog post: "Quantile regression robustness".

Below I am repeating my answer to "Interpolating noisy data".

data = {{0, 0}, {1, 1}, {2, 4}, {3, 9}, {4, 16}, {5, 25}, {6, 36}, {7, 49}, {8, 5}, {9, 81}, {10, 100}};

Import["https://raw.githubusercontent.com/antononcube/\
MathematicaForPrediction/master/QuantileRegression.m"]

knots = 3;
qFunc = First@
   QuantileRegression[data, knots, {0.5}, 
    Method -> {LinearProgramming}];

Show[{ListPlot[data, PlotRange -> All, PlotTheme -> "Detailed", 
   PlotStyle -> Pink], 
  ListLinePlot[{#, qFunc[#]} & /@ data[[All, 1]], Joined -> True]}, 
 ImageSize -> 800, 
 PlotLabel -> Row[{"QuantileRegression with ", knots, " knots"}]]

enter image description here

enter image description here

$\endgroup$

Your Answer

By clicking “Post Your Answer”, you agree to our terms of service and acknowledge you have read our privacy policy.

Not the answer you're looking for? Browse other questions tagged or ask your own question.