Let me give an example
 pfun = ParametricNDSolveValue[{y'[t] == a y[t], y[0] == 1}, y, {t, 0, 10}, {a}];

 Plot[Evaluate[Table[pfun[a][t], {a, -1, 1, .5}]], {t, 0, 1}, PlotRange -> All, PlotLegends -> Automatic]
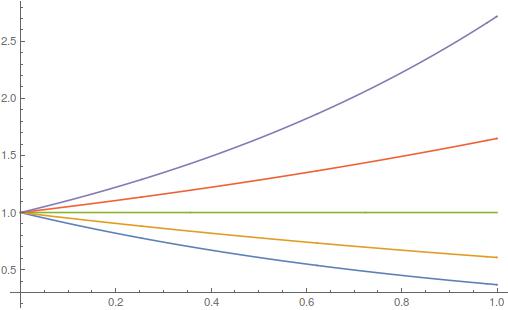
which gives
How can I set, for example, that only the orange curve be thick. One would think to do
PlotStyle->{Default,Thick,Default,Default,Default}
But what if we do
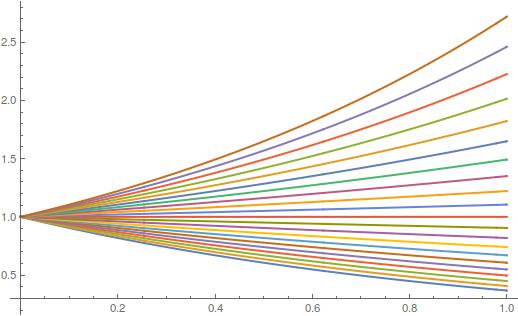
Plot[Evaluate[Table[pfun[a][t], {a, -1, 1, .1}]], {t, 0, 1}, PlotRange -> All, PlotStyle -> Thick]
and get
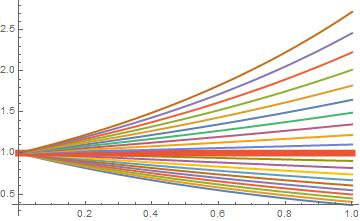
Is there an "elegant" way to give PlotStyle to the curve with a==0, for example?


PlotStyle->{Default,Thickness[0.05],Default,Default,Default}toPlot$\endgroup$