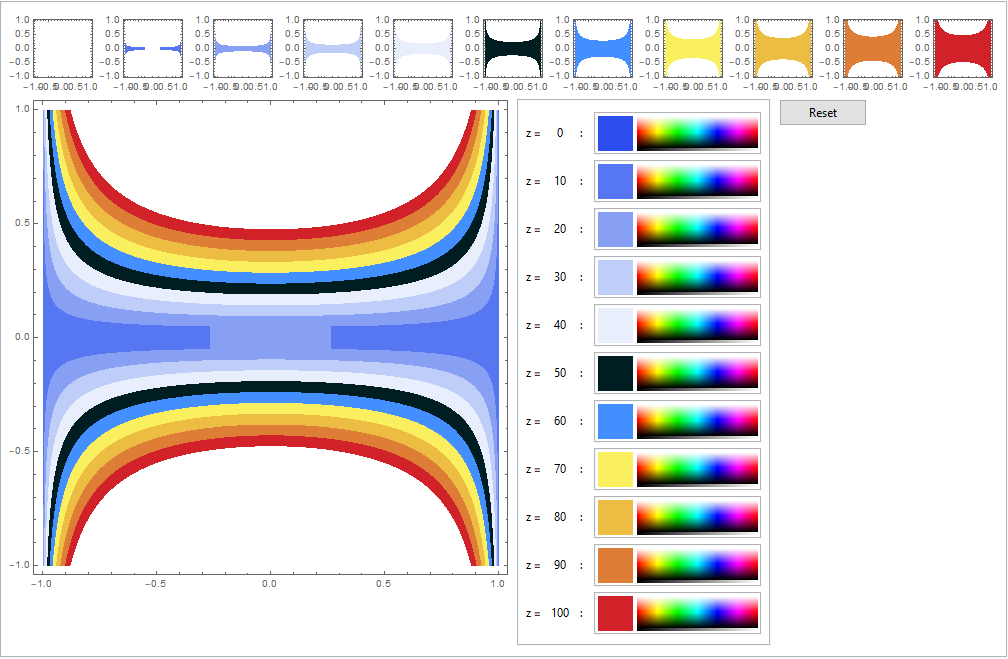
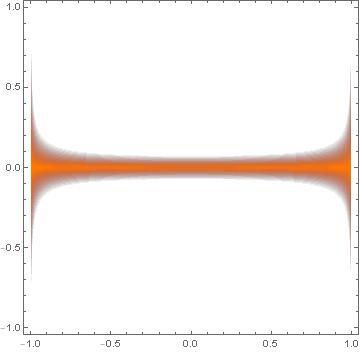
I have to do a RegionPlot of this strange function
func = (x y)^2/z^2 Abs[1 - 1/(x)^2] < 1/(210)^2;
I do it with
plotFunc = RegionPlot[func  /. z -> 10, {x, -1, 1}, {y, -1, 1}, BoundaryStyle -> None,
                      PerformanceGoal -> "Quality", PlotPoints -> 250]
where I needed the PerformanceGoal and PlotPoints to improve the quality of my plot.
Now, I have to overlap plots of this kind for different values of $z$ but I am not sure of the set of color to use, I would like to just change the color at the end, when I'll do the Overlap[...] or Show[...]
Mathematica takes 13 secs to do the plot.
Is there a way to let Mathematica process the points of the plot once for all and then change quickly the color without wasting 13 secs of my time every time I want just to change the color?
I hope my question is clear.


Plotis a reserved symbol, so you cannot assign anything to it. $\endgroup$func... which becomesfunctin your plot. Also,Plothas a built in meaning. Don't try using it for anything else. $\endgroup$funcstill has a syntax error. $\endgroup$