I have read in 600 thresholded gray scale images (located here - 14MB, png, 8bit, 300*200 pixel) into Image3D with:
ChoiceDialog[{FileNameSetter[Dynamic[imageDir], "Directory"], Dynamic[imageDir]}];
SetDirectory[imageDir];

fNames = FileNames["*.png"];

numFiles = Length@fNames;

readImage[index_] :=
  Binarize[First@Image`ImportExportDump`ImageReadPNG[fNames[[index]]],
    FindThreshold@First@Image`ImportExportDump`ImageReadPNG[fNames[[index]]]];

imagesArray3dArray = Image3D[Table[readImage[i], {i, numFiles}]];
The physical dimension of each pixel in x direction is 14 mum, in y direction 12 mum and the "thickness" of an image is 2 mum (corresponding to z direction).
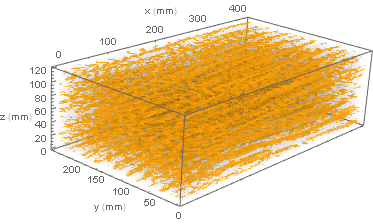
Now I want to plot the 3d volume with the proper axes ranges.
I tried:
imagesSlices = Image3DSlices[imagesArray3dArray];

xPixelSize = 14;
yPixelSize = 12;
zPixelSize = 2;

dim = ImageDimensions[imagesArray3dArray];

Image3D[imagesSlices, BoxRatios -> {dim[[1]]*xPixelSize, dim[[2]]*yPixelSize,
dim[[3]]*zPixelSize}, Boxed -> True, Axes -> True, AxesLabel -> {"x", "y", "z"}]
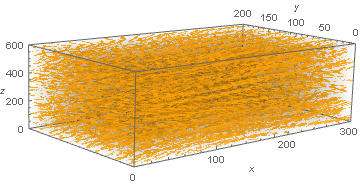
The result is:
As you see the axes ranges of x and y are plotted in pixel values and z corresponds to the image number.
How can I show the axes ranges in physical dimensions considering the correct aspect ratio?


