Okay, here is the information that I have.
closingValues =
  FinancialData["^GSPC", "Close", {"Jan 1., 2000", "Jan 1., 2012"},
   "Value"];
logr = Differences[Log[closingValues]];

x = Tally[Sort[Round[logr, .001]]];
What I want to do is this:
(logr >= x) / Length[logr]
I want to count all the values in logr that are greater than or equal to x (there are about 110 or so values in x).
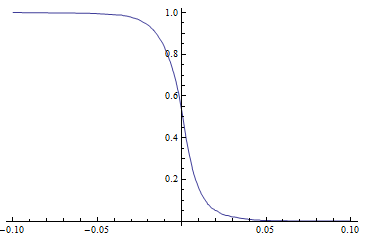
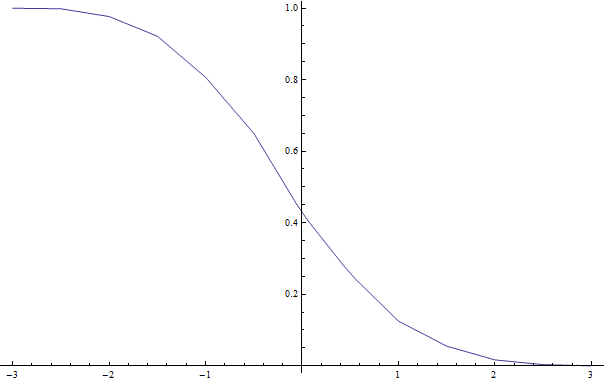
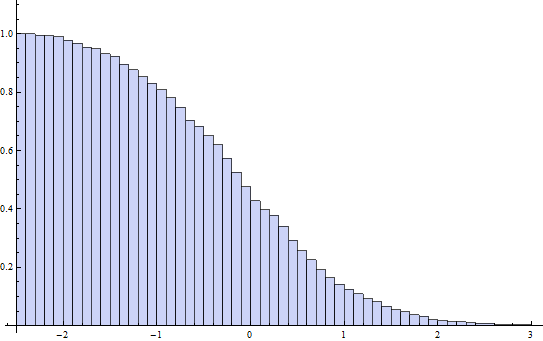
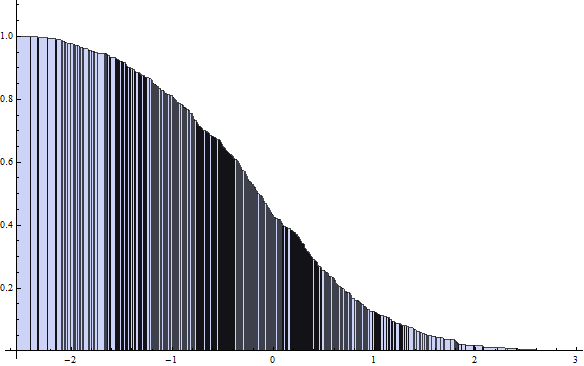
I also need help on plotting a graph where x is on the x-axis, and the resulting number above is on the y-axis.
Any help or advice, or leading me to any direction of solving my problem is greatly appreciated. Thank you.


