7
$\begingroup$

I would like to slice a discrete 3D region with a plane, and integrate some field over the resulting 2D region (embedded in 3D). Let me be clear: I do not mean analytical regions (the kind you could define via ImplicitRegion), but specifically discrete regions, as in my project I am importing those from experimental data.

There are two strategies I have tried. Here is a quick summary:

  • Strategy 1 is to use SliceContourPlot3D with RegionFunction to obtain a 2D region (i.e. surface) embedded in 3D. The problem is that the mesh is faulty and has no boundary, so I cannot e.g. compute fluxes through it. Any suggestions fixing this are more than welcome.
  • Strategy 2 is to transform the problem to in-plane coordinates (i.e. make it a genuine 2D problem) and use the standard two-dimensional RegionPlot. This works. The drawback is that the mesh is purely 2D (no longer embedded in 3D), so I cannot superimpose the result with the original geometry, which is important to me. If there is a nice way of translating/rotating DG2 (effectively increasing its RegionEmbeddingDimension from 2 to 3) I would be very grateful to know.

Now I will construct a simple discrete region and expand the strategies 1 & 2:

IR = ImplicitRegion[
   x^6 - 5 x^4 y + 3 x^4 y^2 + 10 x^2 y^3 + 3 x^2 y^4 - y^5 + y^6 + 
     z^2 <= 1, {x, y, z}];
MR = DiscretizeRegion[IR];

Now I would like to slice MR with some plane.

Strategy 1: SliceContourPlot3D with RegionFunction

Ideally the outcome would be a MeshRegion with RegionDimension 2 and RegionEmbeddingDimension 3. According to this discussion, because RegionPlot3D performs badly with logical statements, a good way to do it is via ContourPlot3D combined with RegionFunction. Here is my attempt:

reg = 1.5;
RP = SliceContourPlot3D[
   1, {x, y, z}.{-1, -1, 1} == 0, {x, -reg, reg}, {y, -reg, 
    reg}, {z, -reg, reg}, PlotPoints -> 20, 
   RegionFunction -> 
    Function[{x, y, z}, SignedRegionDistance[MR, {x, y, z}] < 0]];
DG = DiscretizeGraphics[RP];
DG // FindMeshDefects
RegionBoundary[DG]

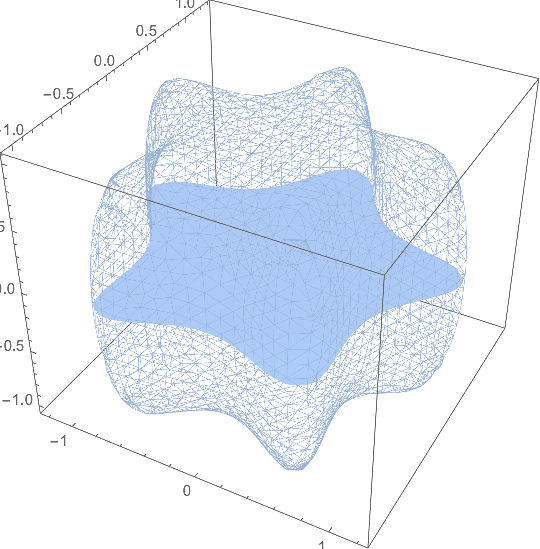
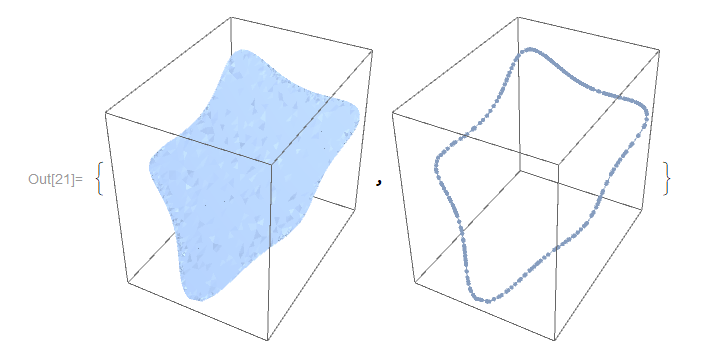
enter image description here

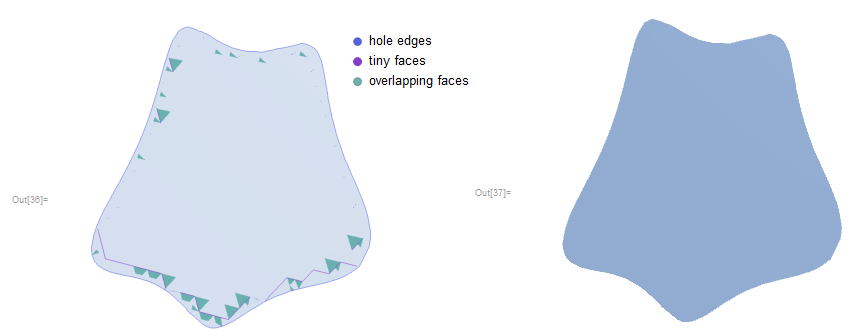
Unfortunately there are mesh defects and probably as a result of that, the RegionBoundary is not computed correctly - it should be a 1D curve. This becomes a big problem when I try to integrate some field over it:

Integrate[Exp[x^2 + y^2 + z^2], {x, y, z} \[Element] DG]

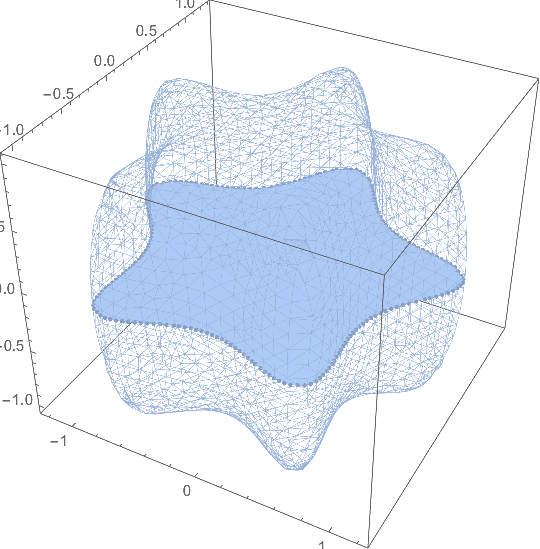
enter image description here

In summary, I have sliced a 3D mesh successfully, obtained a 2D slice embedded in 3D. However, the problem with the boundary prevents me from analysing the slice (e.g. computing fluxes through it). Any suggestions for fixing this are very welcome.

Strategy 2: A plain two dimensional RegionPlot

Here is an alternative approach to the problem, which does work but is less convenient. The idea is to find the in-plane coordinates (not shown here) and treat a 2D region using the classic RegionPlot:

reg = 1.5;
RP2 = RegionPlot[
   RegionMember[MR, {x, y, 0}] == True, {x, -reg, reg}, {y, -reg, 
    reg}, PlotPoints -> 10];
DG2 = DiscretizeGraphics[RP2];
FindMeshDefects[DG2]
DG2 // RegionBoundary

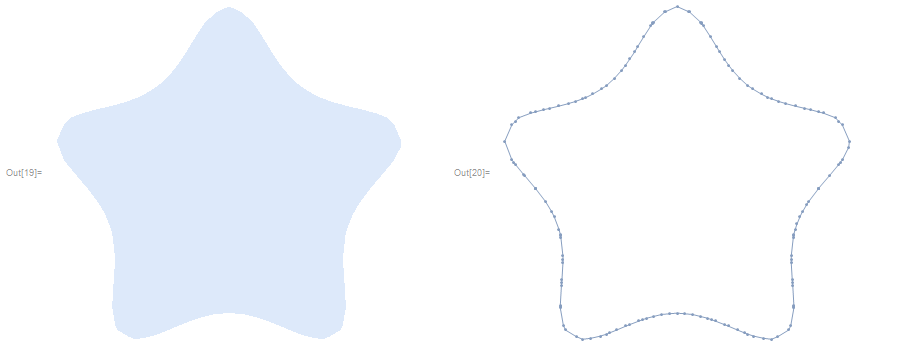
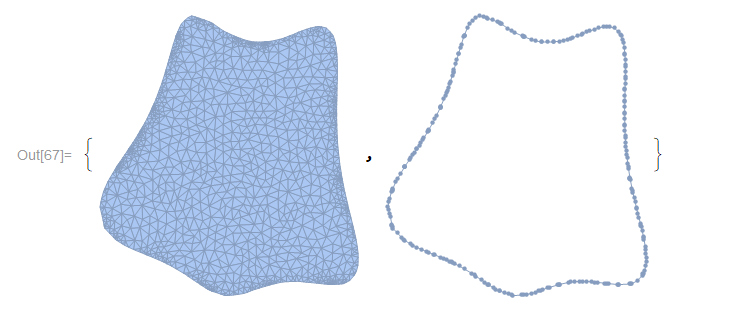
enter image description here

There are no mesh defects, and the boundary is computed correctly. Integrating some field over DG2 or its boundary is now no problem (thanks to Henrik Schumacher for helping with this in the comments):

Integrate[Exp[x^2 + y^2], {x, y} \[Element] DG2]
Integrate[Exp[x^2 + y^2], {x, y} \[Element] RegionBoundary[DG2]]

The drawback is that the mesh is purely 2D (no longer embedded in 3D), so I cannot superimpose the result with the original geometry, which is important to me. If there is a nice way of translating/rotating DG2 (effectively increasing its RegionEmbeddingDimension from 2 to 3) I would be very grateful to know.

Comment/Disclaimer

I have a feeling Mathematica is not designed for what I am trying to do, but this is not completely obvious to me from documentation. MeshRegions Which come from ImplicitRegion or predefined regions like Ball[] appear to be discretized very differently from inherently discrete regions. The current question is an extension of my previous question.

$\endgroup$
10
  • 2
    $\begingroup$ Sorry, I cannot reproduce RP2. (I have only MMA 11.0.1; maybe that is the reason.) Note however that DG2 is a 2-dimensional MeshRegion and thus has infinite ArcLength (read ArcLength as 1-dimensional Hausdorff measure). ArcLength[RegionBoundary[DG2]] will give you the desired result. $\endgroup$ Commented Sep 21, 2017 at 21:46
  • $\begingroup$ Thank you, that's a very helpful comment about the arclength. As expected NIntegrate[1, x \[Element] RegionBoundary[DG2]] - ArcLength[RegionBoundary[DG2]] is close to zero. However, any idea why NIntegrate[x, x \[Element] RegionBoundary[DG2]] returns two values rather than one? P.S. Which part were you unable to reproduce? Does DiscretizeGraphics fail by any chance? I'm on MMA 11.0.1 too. $\endgroup$ Commented Sep 21, 2017 at 22:05
  • 1
    $\begingroup$ In this integral, x is a point, hence NIntegrate[x, x \[Element] RegionBoundary[DG2]] should return the barycenter of the boundary curve times arclength of the boundary curve. $\endgroup$ Commented Sep 21, 2017 at 22:09
  • 1
    $\begingroup$ Here, x is not a parameterization parameter of the boundary curve; its a (2-dimensional) point on the curve. Maybe, it becomes clearer if you consider expressions of the form NIntegrate[f[x], x \[Element] RegionBoundary[DG2]], where $f \colon \mathbb{R}^2 \to \mathbb{R}^m$ is a function on the plane. Then NIntegrate tries to approximate $\int_{\partial \operatorname{DG}} f(x) \, \operatorname{d} \mathcal{H}^1(x) \in \mathbb{R}^m$. $\endgroup$ Commented Sep 21, 2017 at 22:47
  • 1
    $\begingroup$ You can reembed the DG2 back to $\mathbb{R}^3$, e.g., with MeshRegion[ Transpose[ Append[Transpose[MeshCoordinates[DG2]], ConstantArray[0., MeshCellCount[DG2, 0]]]], MeshCells[DG2, 2] ] $\endgroup$ Commented Sep 22, 2017 at 11:09

3 Answers 3

4
$\begingroup$

If your surface to intersect with is given by an implicit equation (such as $z=0$ in your example), SliceContourPlot3D can produce quite acceptable results.

IR = ImplicitRegion[
   x^6 - 5 x^4 y + 3 x^4 y^2 + 10 x^2 y^3 + 3 x^2 y^4 - y^5 + y^6 + 
     z^2 <= 1, {x, y, z}];
MR = DiscretizeRegion[IR];
f = {x, y, z} \[Function] z;
plot = SliceContourPlot3D[1, f[x, y, z] == 0, {x, y, z} \[Element] MR];
DG3 = DiscretizeGraphics[plot];

Show[
 MeshRegion[RegionBoundary[MR], PlotTheme -> "Lines"],
 DG3,
 Axes -> True,
 Boxed -> True
 ]

enter image description here

Unfortunately, RegionBoundary[DG3] will not produce any MeshRegion that represents the boundary curve any more...

This must be done by hand. Fortunately, SliceContourPlot3D creates line objects for the boundary curves, deeply hidden within a GraphicsComplex. We just have to parse it and reorder some vertex positions:

BDG3 = Module[{gc, lines, plist, pts, s},
  gc = Extract[plot, Position[plot, _GraphicsComplex]][[1]];
  lines = Extract[gc, Position[gc, _Line]][[All, 1]];
  plist = Union @@ lines;
  pts = gc[[1, plist]];
  s = AssociationThread[plist -> Range[Length[plist]]];
  MeshRegion[
   gc[[1, plist]], (x \[Function] Line[Lookup[s, x]]) /@ lines]
  ];
Show[
 MeshRegion[RegionBoundary[MR], PlotTheme -> "Lines"],
 DG3,
 BDG3,
 Axes -> True,
 Boxed -> True
 ]

enter image description here

$\endgroup$
3
  • $\begingroup$ Your solution is absolutely brilliant, especially the second part where you extract the boundary points. Would there be a way to construct a MeshRegion from BDG3, so that I could integrate some field over? Ideally I would have a MRPerfect such that Integrate[Exp[x^2 + y^2 + z^2], {x, y, z} \[Element] MRPerfect] works, and such that BDG3 would be the BoundaryMesh of MRPerfect. $\endgroup$ Commented Sep 22, 2017 at 15:32
  • $\begingroup$ I tried BoundaryDiscretizeRegion[BDG3] which fails. Perhaps Mathematica does not recognise that all points are in a plane. I suspect that one would have to pick a point in the region (say RegionCentroid) and then manually define triangles from there to every boundary point. $\endgroup$ Commented Sep 22, 2017 at 17:02
  • $\begingroup$ @AlexanderErlich BoundaryDiscretizeRegion works only for (n-1)-dimensional MeshRegions embedded in $\mathbb{R}^n$, $n\in \{2,3\}$. "Boundary" in Mathematica tends to mean "topological boundary" rather than "boundary of a manifold". Thus, in its current implementation, you cannot achieve BDG3 == BoundaryMesh[MRPerfect] being true. This is why I defined BDG3 by hand. Use DG3 above as the "interior". $\endgroup$ Commented Sep 23, 2017 at 0:23
3
$\begingroup$

As an alternative to Henrik's brilliant and very low level solution, I would like to propose an alternative based on my "Strategy 2". The idea is to transform the problem to 2D, solve it in 2D, then re-embed in 3D.

First, I find a set of appropriate in-plane basis vectors bvec1, bvec2:

IR = ImplicitRegion[
   x^6 - 5 x^4 y + 3 x^4 y^2 + 10 x^2 y^3 + 3 x^2 y^4 - y^5 + y^6 + 
     z^2 <= 1, {x, y, z}];
MR = DiscretizeRegion[IR];

x0vec = {1/2, 1/3, -1/3};
normal = {1, - 1, 1} // Normalize;
bvec1 = Cross[{0, 0, 1}, normal] // Normalize;
bvec2 = Cross[normal, bvec1] // Normalize;

Next, we use the 2D variant of RegionPlot to extract the region and its boundary:

DG2D = DiscretizeGraphics[
   RegionPlot[
    RegionMember[MR, x0vec + a*bvec1 + b*bvec2] == True, {a, -2, 
     2}, {b, -2, 2}]];
DG2DBoundary = RegionBoundary[DG2D];
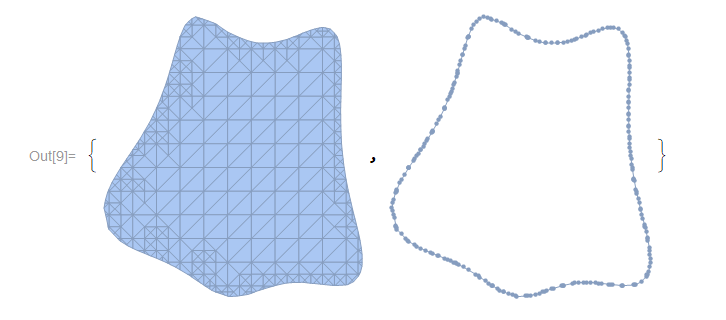
{DG2D, DG2DBoundary}

enter image description here

As ultimately my goal is to integrate over these regions, I refine the mesh via ToElementMesh:

(* optional: enhance 2D region *)
<< NDSolve`FEM`
DG2D = MeshRegion[
   ToElementMesh[DG2DBoundary, MaxCellMeasure -> 0.005]];
{DG2D, DG2DBoundary}

enter image description here

Now we can embed the regions in 3D by directly manipulating coordinates:

EmbedMeshRegionIn3D[reg_] := Module[{coords},
  coords = {x0vec + #1 bvec1 + #2 bvec2 } & @@@ MeshCoordinates[reg];
  MeshRegion[Flatten[coords, 1], MeshCells[reg, RegionDimension[reg]]]
  ]
DG3D = EmbedMeshRegionIn3D[DG2D];
DG3DBoundary = EmbedMeshRegionIn3D[DG2DBoundary];
MeshRegion[EmbedMeshRegionIn3D[#], Boxed -> True] & /@ {DG3D, 
  DG3DBoundary}

enter image description here

Not sure what the weird colouring on the left image is about (DG3D // FindMeshDefects finds no problems).

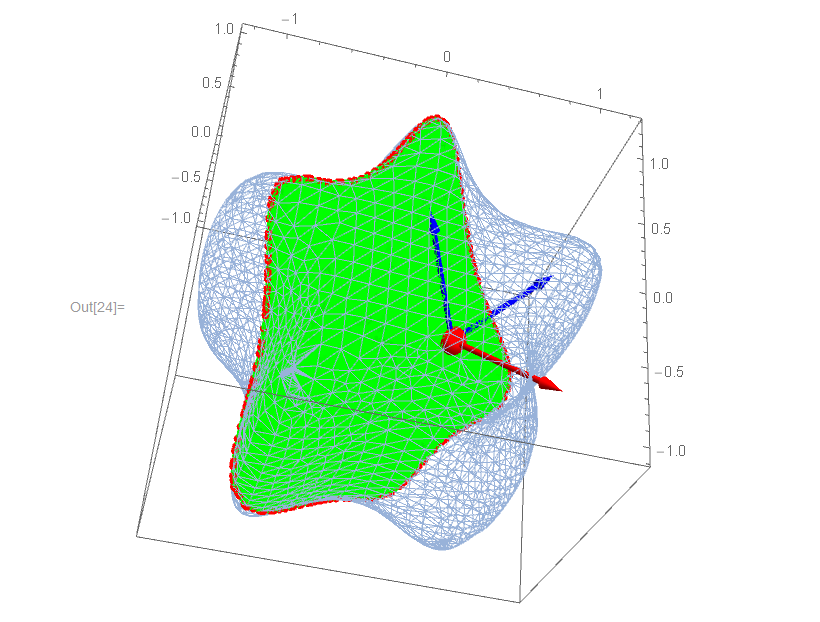
We now plot the results, with the in-plane basis vectors bvec1, bvec2 in blue and surface normal in red:

Show[
 MeshRegion[RegionBoundary[MR], PlotTheme -> "Lines"],
 MeshRegion[DG3D, MeshCellStyle -> Green],
 MeshRegion[DG3DBoundary, 
  MeshCellStyle -> Directive[Red, PointSize[0.015]]],
 Graphics3D[{Red, Sphere[x0vec, 0.1]}],
 Graphics3D[{Red, Arrow[Tube[{x0vec, x0vec + normal}, 0.02]]}],
 Graphics3D[{Blue, Arrow[Tube[{x0vec, x0vec + bvec1}, 0.02]], 
   Arrow[Tube[{x0vec, x0vec + bvec2}, 0.02]] }],
 Axes -> True, Boxed -> True]

enter image description here

Now, let us integrate over the 2D and 3D region and see if the results are the same. First, a test to make sure that areas are is computed correctly:

    NIntegrate[1, {x, y, z} \[Element] DG3D] == 
     NIntegrate[1, {a, b} \[Element] DG2D] == Area[DG3D] == Area[DG2D]
(* OUT: True *)

Note that if you omit the mesh refinement step (the part with ToElementMesh), this will return False, and the area computation is somehow messed up:

NIntegrate[1, {x, y, z} \[Element] DG3D] - Area[DG3D] 
(* OUT: -0.254965 [if mesh refinement is omitted] *)

Finally, we can integrate some field over the region. Let us compare the integration in 2D and 3D as a test:

field[x_, y_, z_] := Exp[x^2 + y^2 + z^2]
flux2D = NIntegrate[
   field @@ (x0vec + a*bvec1 + b*bvec2), {a, b} \[Element] DG2D];
flux3D = NIntegrate[field[x, y, z], {x, y, z} \[Element] DG3D];
flux2D == flux3D

After a long day:

(* Out: True *)
$\endgroup$
3
$\begingroup$

The MeshFunctions option of RegionPlot3D[] can also be used to generate an initial slice for further refinement:

(* mesh to be sliced *)
IR = ImplicitRegion[x^6 - 5 x^4 y + 3 x^4 y^2 + 10 x^2 y^3 + 3 x^2 y^4
                    - y^5 + y^6 + z^2 <= 1, {x, y, z}];
MR = DiscretizeRegion[IR];

(* plane parameters *)
x0vec = {1/2, 1/3, -1/3};
normal = {1, -1, 1} // Normalize;

p1 = RegionPlot3D[MR, Mesh -> {{0}}, MeshFunctions -> {normal.({#1, #2, #3} - x0vec) &},
                  PlotPoints -> 155];

slice = DiscretizeRegion[Polygon[First[Cases[Normal[p1], Line[l_] :> l, ∞]]], 
                         MaxCellMeasure -> {"Length" -> 0.05}]

slice of a mesh

Let me stress again that this is only a starting point; the resolution of the contour produced by MeshFunctions is not that high, and thus needs to be further refined (e.g. with the methods in Alexander's answer).

$\endgroup$

Your Answer

By clicking “Post Your Answer”, you agree to our terms of service and acknowledge you have read our privacy policy.

Not the answer you're looking for? Browse other questions tagged or ask your own question.