16
$\begingroup$

One can construct a holomorphic bijection between the (open) unit disc $D=\{z\in{\bf C}: |z|<1\}$, and a domain $D\setminus\overline{B_{1/2}(-1/2)}$ where $B_r(z_0)$ denotes the ball of radius $r$ centered at $z_0$. One of such function is given by $$ F(z)=g\left(\frac{Log(g^{-1}(z))}{\pi}\right) $$ where $g(z)=\dfrac{i-z}{i+z}$.

I would like to visualize this function by plotting the images of some horizontal lines inside $D$.

(*Definition of the function F*)
g[z_] := (I - z)/(I + z);
g1[z_] := InverseFunction[g][z];
F[z_] := g[Log[g1[z]]/Pi];

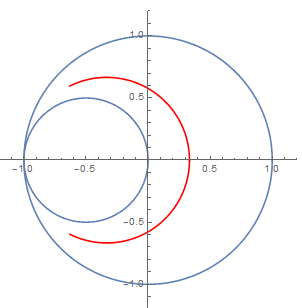
I can plot the images of the horizontal lines except the one through the origin, namely the interval $(-1,1)$ on the real line:

 Show[
 ParametricPlot[{ReIm[F[x + I*0]]}, {x, -1 + 0.001, 1 - 0.001},
  PlotRange -> {{-1.2, 1.2}, {-1.2, 1.2}},
  PlotStyle -> Red],
 ParametricPlot[{Cos[x], Sin[x]}, {x, 0, 2 Pi}],
 ParametricPlot[{Cos[x]/2 - 1/2, Sin[x]/2}, {x, 0, 2 Pi}],
 ImageSize -> 300]

enter image description here

The red line is supposed to be a closed circle except at the point $z=-1+0i$. How can I fixed my code to get that?


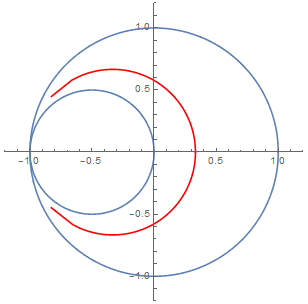
I have tried to replace x, -1 + 0.001, 1 - 0.001 with x, -1 + 0.00001, 1 - 0.00001 which gives something like this:

enter image description here

where one can still see the defects of the arc. Raising the PlotPoints make it better a bit but when 0.00001 is replaced with a even smaller number, it seems unfeasible. Of course, one can cheat by writing directly a circle. But I'm particular interested in whether it is possible to fix the code directly (since such "limiting" case is very common when visualizing other holomorphic functions).

$\endgroup$
1
  • 1
    $\begingroup$ You can improve the result by using MaxRecursion->15 (but it's still far from perfect) $\endgroup$
    – Lukas Lang
    Commented Sep 17, 2017 at 20:12

2 Answers 2

14
$\begingroup$

This is as close as you can get with machine precision:

F[-1 + $MachineEpsilon/2 + 0. I]
(*  -0.979196 + 0.165246 I  *)

One should think about how far the value is from -1 + 0 I, because it suggests closing the gap will be difficult. For instance, a delta-x of 10^-100 is almost acceptably close to -1:

N@F[-1 + 10.`100^-100]
(*  -0.999445 + 0.0271943 I  *)

In ParametricPlot, one can raise the WorkingPrecision, as well as MaxRecursion (to the max 15) and PlotPoints. (Increasing PlotPoints produces a marginally negligible improvement.)

For instance, this won't quite do it, because you'd probably need to raise PlotPoints to around 10^100:

ParametricPlot[{Limit[ReIm[F[xx + I*0]], xx -> x]}, {x, -1, 1}, 
 PlotRange -> {{-1.2, 1.2}, {-1.2, 1.2}}, MaxRecursion -> 15, 
 PlotPoints -> 200, PlotStyle -> Red, WorkingPrecision -> 50]

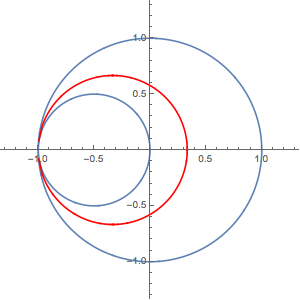
Using a substitution (x == Sin[t]) to get closer to ±1 helps:

Show[
 ParametricPlot[{Cos[x], Sin[x]}, {x, 0, 2 Pi}],
 ParametricPlot[{Cos[x]/2 - 1/2, Sin[x]/2}, {x, 0, 2 Pi}],
 ParametricPlot[{ReIm[F[Sin[t] + I*0]]}, {t, -Pi/2, Pi/2}, 
  MaxRecursion -> 15, PlotPoints -> 100, PlotStyle -> Red, 
  WorkingPrecision -> 50],
 ImageSize -> 300, PlotRange -> {{-1.2, 1.2}, {-1.2, 1.2}}]

Mathematica graphics

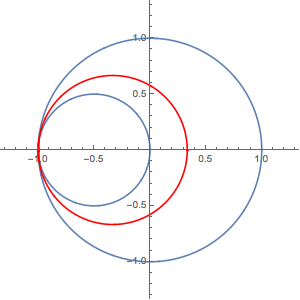
Here's the best I can do with producing a complete graph, but it's a bit slow:

ifn = NDSolveValue[{f'[x] == D[F[x + I*0], x], f[0] == F[0]},
   f, {x, -1, 1}, PrecisionGoal -> 8, WorkingPrecision -> 1000]

Show[
 ParametricPlot[{Cos[x], Sin[x]}, {x, 0, 2 Pi}],
 ParametricPlot[{Cos[x]/2 - 1/2, Sin[x]/2}, {x, 0, 2 Pi}],
 ListLinePlot[ReIm@ifn["ValuesOnGrid"], PlotStyle -> Red, 
  PlotRange -> All],
 ImageSize -> 300]

Mathematica graphics

It gets pretty close to -1:

ifn@ifn["Domain"] // N
(*  {{-0.999998 + 0.00263916 I, -0.999998 - 0.00263916 I}}  *)

BEWARE: Raising WorkingPrecision above 1000 in NDSolve above, which in theory would produce a better result, actually caused my kernel to crash.

$\endgroup$
1
  • $\begingroup$ Pity I can't accept both answers. I've accepted this one as it answers my question directly. $\endgroup$
    – user664
    Commented Sep 18, 2017 at 16:15
25
$\begingroup$

I would like to visualize this function by plotting the images of some horizontal lines inside D.

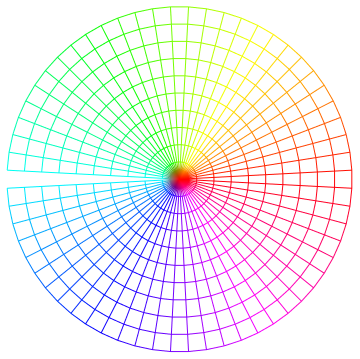
I believe you can gain more insight if you circumvent this ugliness of your mapping completely and look at it a bit differently. Take for instance this sampling of the unit disk (that spares the points on the boundary:

dphi = Pi/30;
rend = 0.99;
pts = Table[
  r*Exp[I N[phi, 30]], {phi, -Pi + dphi/2, Pi - dphi/2, dphi},
 {r, 0, rend, rend/10}];

toColor[z_] := List @@ ColorConvert[Hue[Arg[N[z]]/(2 Pi)], "RGB"]
line[pts_] := line[pts, Identity];
line[pts_, func_] := Line[ReIm[func[pts]], VertexColors -> (toColor /@ pts)]
Graphics[{line /@ pts, line /@ Transpose[pts]}]
Mathematica graphics

I left the right part out on purpose. The colour indicates the phase.

Now take your function

g[z_] := (I - z)/(I + z);
g1[z_] := InverseFunction[g][z];
F[z_] := g[Log[g1[z]]/Pi];
cF = Compile[{{z, _Complex, 0}},
    #,
    Parallelization -> True,
    RuntimeAttributes -> {Listable}
    ] &[F[z]]

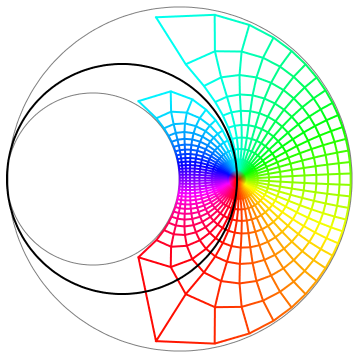
Additionally, observe that the almost circle you want to plot can easily be calculated by using F[0] and the second point at -1. What you can do now is plot your circles together with the mapping of your grid

Graphics[{Gray, Circle[{-.5, 0}, .5], Circle[], Thick, Black,
  line[#, cF] & /@ pts, line[#, cF] & /@ Transpose[pts], 
  Circle[{Mean[{-1, 1/3}], 0}, 4/6]}]
Mathematica graphics

Now, you get a good feeling for why it is so hard to plot that circle that is created by the real line. Additionally, note that the colouring shows the colours of the input values. At least for me, this draws a much better picture of how the unit disk is wrapped to create the mapping.

Final note

As we now have seen, we need an extremely dense sampling near -1 and 1 to make the circle. One idea is to throw in an additional transformation that helps us to achieve this. We can use for instance Erf that maps -Infinity to -1 and Infinity to 1. Defining an additional function, we then can almost close the circle in a simple line-drawing way:

g[z_] := (I - z)/(I + z);
g1[z_] := InverseFunction[g][z];
F[z_] := g[Log[g1[z]]/Pi];
F2[z_] := ReIm@F[Erf[z]];

$MaxExtraPrecision = 1000;
circ = F2 /@ Range[-40, 40, 1/10];
Graphics[Line[N[circ, 300]]]

circ

In addition, we can use a similar scheme to refine our visualization mesh and can easily create a much denser representation. We will use your original F and the only thing we change is that we create a mesh that will look good under the transformation.

Save your work before evaluating this; your computer might explode.

Some things to consider:

  1. Until you have calculated F for a specific z, make sure you use no numerical approximation. This means all points of the mesh are created with integers or rational numbers
  2. We will create a mesh for the quadrants 3 and 4 and will reflect it by complex conjugating the (complex) points

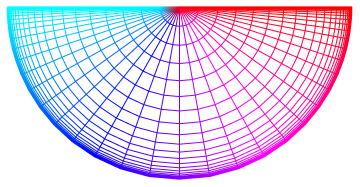
Here are the redefined points for our mesh

plotPointsPhi = 100;
plotPointsR = 100;
phiEnd = 5;
rend = 10;
pts = Table[
   Erf[r]*Exp[I (Pi/2*Erf[phi] - Pi/2)], {phi, -phiEnd, phiEnd, 
    2 phiEnd/plotPointsPhi}, {r, 0, rend, rend/plotPointsR}];

I put the numerical evaluation of the numbers in the line function, therefore here the redefinition

toColor[z_] := List @@ ColorConvert[Hue[Arg[N[z]]/(2 Pi)], "RGB"]

ClearAll[line];
line[pts_] := line[pts, Identity];
line[pts_, func_] := 
 Line[ReIm[N[func[pts], 300]], VertexColors -> (toColor /@ pts)]

Graphics[{line /@ pts, line /@ Transpose[pts]}]

This is our mesh. Look how extremely dense we are at the boundary.
Mathematica graphics

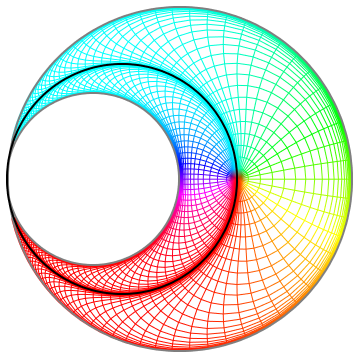
Now, it's as simple as doing what we did before:

Graphics[{
  line[#, F] & /@ pts,
  line[#, F] & /@ Transpose[pts],
  line[#, F] & /@ Conjugate[pts],
  line[#, F] & /@ Conjugate[Transpose[pts]],
  Thick,
  Gray,
  Circle[{-.5, 0}, .5],
  Circle[],
  Black,
  Circle[{Mean[{-1, 1/3}], 0}, 4/6]
  }]

Et voila
Mathematica graphics

$\endgroup$
7
  • 1
    $\begingroup$ +1 My first thought was along these lines, but I guess I was seduced by the numerics of trying to get the OP's circle drawn. $\endgroup$
    – Michael E2
    Commented Sep 18, 2017 at 0:33
  • $\begingroup$ @MichaelE2 I was looking at your answer and saw that you already made a deep investigation. This is why I tried something different. I was thinking for a while if it is possible to insert another transformation into F that makes sampling of those points close to -1 and 1 easier but I wasn't sure if this doesn't blow the numerics as well in the end. $\endgroup$
    – halirutan
    Commented Sep 18, 2017 at 0:38
  • $\begingroup$ Thanks for the answer! My code is based on what I have naively learned so far. I shall definitely try to digest yours eventually. In particular I like very much the colors you add. $\endgroup$
    – user664
    Commented Sep 18, 2017 at 0:50
  • 2
    $\begingroup$ @Jack, halirutan, F[2/Pi*ArcTan[-Exp[2/(t + 1)] + Exp[2/(1 - t)]] + I*0]., {t, -1, 1}, is a better transformation. $\endgroup$
    – Michael E2
    Commented Sep 18, 2017 at 2:05
  • $\begingroup$ Great! Would you post the code for the last figure as well (I would like to see how the mesh is refined)? $\endgroup$
    – user664
    Commented Sep 18, 2017 at 2:18

Your Answer

By clicking “Post Your Answer”, you agree to our terms of service and acknowledge you have read our privacy policy.