4
$\begingroup$

I have some data points:

A=Uncompress[FromCharacterCode[
  Flatten[ImageData[Import["https://i.sstatic.net/s6rlR.png"],"Byte"]]]]

B=Uncompress[FromCharacterCode[
  Flatten[ImageData[Import["https://i.sstatic.net/jylyd.png"],"Byte"]]]]

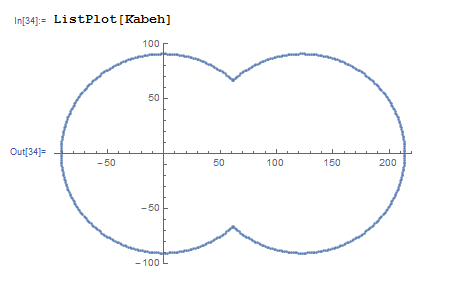
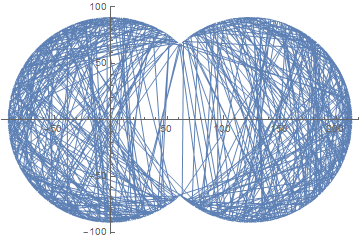
If A and B are $\color{blue}{\text{joined}}$ and plotted in graphic to be below

enter image description here

My questions:

  1. How to determine the value of both radius or diameter of circles?

  2. How to determine the distance between circle 1 and circle 2?

$\endgroup$

7 Answers 7

5
$\begingroup$
d = {#1^2, #1, #2, #2^2} & @@@ A;
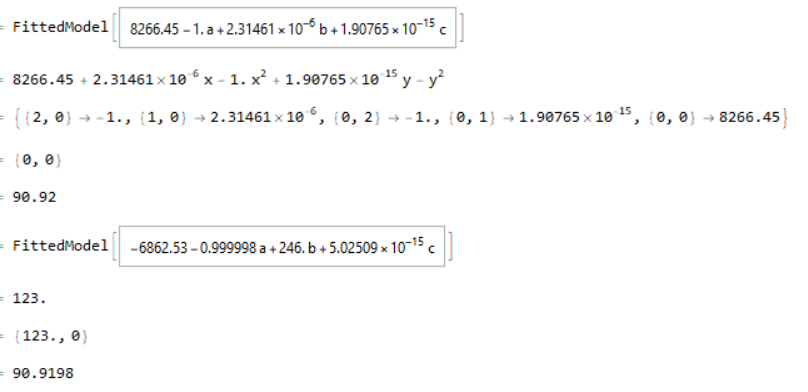
lm = LinearModelFit[d, {1, a, b, c}, {a, b, c}]
ex = lm["BestFitParameters"].{1, x^2, x, y} - y^2
ru = CoefficientRules[ex]
c0 = {0, 0}
r0 = Sqrt[{0, 0} /. ru]
d2 = {#1^2, #1, #2, #2^2} & @@@ B;
lm2 = LinearModelFit[d2, {1, a, b, c}, {a, b, c}]
x1 = ({1, 0} /. cr)/2
c1 = {x1, 0}
r1 = ({0, 0} /. cr) + x0^2 // Sqrt
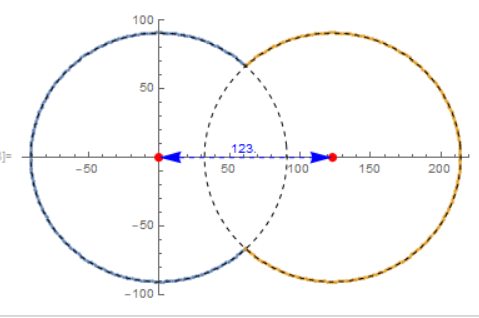
ListPlot[{A, B}, 
 Epilog -> {Dashed, Circle[c0, r0], Circle[c1, r1], Red, 
   PointSize[0.02], Point[{c0, c1}], Blue, Arrowheads[{-0.05, 0.05}], 
   Arrow[{c0, c1}], Text[x1, (c0 + c1)/2, {0, -1}]}]

enter image description here enter image description here

$\endgroup$
2
  • $\begingroup$ I think the OP try to know the two radius form RandomSample[Join[A, B]] but not from A then B $\endgroup$
    – yode
    Commented Sep 12, 2017 at 11:21
  • $\begingroup$ @yode the 2 radii are in the text that follows the image with the centers preceding. $\endgroup$
    – ubpdqn
    Commented Sep 12, 2017 at 11:23
3
$\begingroup$

Well,a method based on Image Processing strik to my mind.Let do it.

Build a image for your data

pos = Join[A, B];
bound = MinMax /@ Transpose[pos];
bin = ReplaceImageValue[
  ConstantImage[0, Ceiling[Subtract @@@ (Reverse /@ bound)]], 
  TranslationTransform[-First /@ bound][pos] -> 1]

Mathematica graphics

Do a DistanceTransform in bin and get what your are after

ImageAdjust[dist = DistanceTransform[FillingTransform[Dilation[bin, 1]]]]

Mathematica graphics

TakeLargest[Flatten[ImageData[dist]], 2]

{92.0054, 92.0054}

And I think if your are in the 11.2 comming up,RegionImage will make your life be easer when you build that bin.

$\endgroup$
2
  • $\begingroup$ +1 Neat! Learned a lot from your answer. $\endgroup$
    – ubpdqn
    Commented Sep 12, 2017 at 10:52
  • $\begingroup$ @ubpdqn Thanks for kind word.. $\endgroup$
    – yode
    Commented Sep 12, 2017 at 11:19
3
$\begingroup$

Using CirclePoints:

Clear["Global`*"]
A = Uncompress[
   FromCharacterCode[
    Flatten[ImageData[Import["https://i.sstatic.net/s6rlR.png"], 
      "Byte"]]]];
B = Uncompress[
   FromCharacterCode[
    Flatten[ImageData[Import["https://i.sstatic.net/jylyd.png"], 
      "Byte"]]]];

It would be simpler to do this with presented and separated data such A and B, so to make it more general and interesting, shuffle these points together and visualize:

apts = RandomSample[A, Length@A];
bpts = RandomSample[B, Length@B];
pts = Join[apts, bpts];

ListLinePlot[pts, AspectRatio -> Automatic]

enter image description here

Take any three points at a time from the shuffled set and generate many (say 100) circles. Later, select the two commonest circles after appropriate rounding.

circs = Table[CircleThrough[RandomChoice[pts, 3]], 100];

circsSel = (GatherBy[
      circs, {Round[Last@#, 0.01], Round[First@#, 0.01]} &]) // 
    MaximalBy[#, Length, 2] & // Map[Round[#, 0.001] &, #, {3}] & // 
  Map[Commonest]

{{Circle[{0., 0.}, 90.92]}, {Circle[{123., 0.}, 90.92]}}

The distance between corresponding circles is:

EuclideanDistance @@ RegionCentroid @@@ circsSel
$\endgroup$
3
$\begingroup$

Direct minimization using RegionDistance:

A = Uncompress[
   FromCharacterCode[
    Flatten[ImageData[Import["https://i.sstatic.net/s6rlR.png"], 
      "Byte"]]]];

B = Uncompress[
   FromCharacterCode[
    Flatten[ImageData[Import["https://i.sstatic.net/jylyd.png"], 
      "Byte"]]]];

circles[{x1_?NumericQ, y1_, r1_}, {x2_, y2_, r2_}, pts_] := Total[
  RegionDistance[
    RegionUnion[Circle[{x1, y1}, r1], Circle[{x2, y2}, r2]],
    pts
    ]^2
  ]

FindMinimum[
 circles[{x1, y1, r1}, {x2, y2, r2}, Join[A, B]],
 {{x1, 0}, {y1, 0}, {r1, 100}, {x2, 120}, {y2, 0}, {r2, 100}}
 ]

{8.1940710^-6, {x1 -> 6.7457910^-8, y1 -> -7.4474610^-9, r1 -> 90.92, x2 -> 123., y2 -> -7.4822610^-9, r2 -> 90.92}}

$\endgroup$
2
$\begingroup$

Denote $f(x_i,y_i)=(x_i-x_0)^2+(y_i-y_0)^2$ a squared distance from a data point $(x_i,y_i)$ to the supposed circle center $(x_0,y_0)$. The idea is like this: values of $|f(x_i,y_i)-f(x_j,y_j)|$ or $(f(x_i,y_i)-f(x_j,y_j))^2$ should be small if $(x_0,y_0)$ is at the same distance from all $(x_i,y_i)$. For example one can minimize function $$ g(x_0,y_0)=\sum_{i=2}^n(f(x_{i},y_{i})-f(x_{i-1},y_{i-1}))^2 $$ wrt $(x_0,y_0)$.

f[x_, y_] = ((x - x0)^2 + (y - y0)^2);
distsqrd = f @@@ A;
g = Total@(ListConvolve[{-1, 1}, distsqrd]^2);

Minimizing $g$:

minA = NMinimize[g, {x0, y0}]

{0.01583549,{x0->0.000013,y0->-9.5718009*10^-10}}

Now taking the mean value of distances obtained gives

rA = Mean[(distsqrd /. minA[[2]])^(1/2)]

90.9200011

The same procedure for B gives

minB

{0.61139090, {x0 -> 123.000010, y0 -> 1.2381995*10^-15}}

rB

90.9200036

The distance between the circle centers is

Norm[({x0, y0} /. minA[[2]]) - ({x0, y0} /. minB[[2]])]

122.99999706

$\endgroup$
2
$\begingroup$
A = Uncompress[FromCharacterCode[
Flatten[ImageData[Import["https://i.sstatic.net/s6rlR.png"], 
  "Byte"]]]];
B = Uncompress[FromCharacterCode[
Flatten[ImageData[Import["https://i.sstatic.net/jylyd.png"], 
  "Byte"]]]];
data = Join[A, B];

f[c1_, c2_, p_] := Min[Abs[(p[[1]] - c1[[1]])^2 + (p[[2]] - c1[[2]])^2 - c1[[3]]^2], Abs[(p[[1]] - c2[[1]])^2 + (p[[2]] - c2[[2]])^2 - c2[[3]]^2]]
obj = Sum[f[{x1, y1, r1}, {x2, y2, r2}, data[[k]]], {k, 1, Length[data]}];
sol = Quiet@NMinimize[{obj, Abs[r1 - r2] > 100}, {x1, y1, r1, x2, y2, r2}, Method -> "DifferentialEvolution"]

c1 = ((x - x1)^2 + (y - y1)^2 - r1^2) /. sol[[2]]
c2 = ((x - x2)^2 + (y - y2)^2 - r2^2) /. sol[[2]]

gr1 = ListPlot[data, Axes -> False]
gr2 = ContourPlot[c1 == 0, {x, -100, 250}, {y, -150, 150}, ContourStyle -> {Dashed, Red}];
gr3 = ContourPlot[c2 == 0, {x, -100, 250}, {y, -150, 150}, ContourStyle -> {Dashed, Red}];
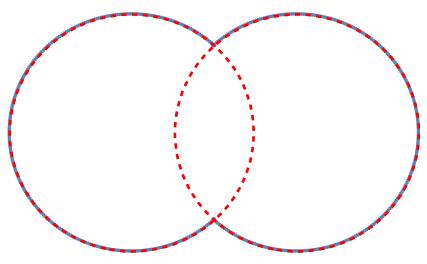
Show[gr1, gr2, gr3]

enter image description here

$\endgroup$
0
$\begingroup$

How to solve this depends on what you're willing/able to assume.

If we assume that you have two overlapping circles of the same radius and the line two centers of the circle have the same vertical coordinate, then the following works:

circles = Join[A, B];
x = MinMax[circles[[All, 1]]];
y = MinMax[circles[[All, 2]]];
radius = Differences[y]/2
(* {90.92} *)
distance = Differences[x] - 2*radius
(* {123.} *)

If the two centers have different vertical coordinates, then one can figure out the angle of rotation, unrotate, and apply the code above.

$\endgroup$

Your Answer

By clicking “Post Your Answer”, you agree to our terms of service and acknowledge you have read our privacy policy.

Not the answer you're looking for? Browse other questions tagged or ask your own question.