I have been using Mathematica for quite a while but am really stuck with this problem for too long now and appreciate any help. Thanks a lot.
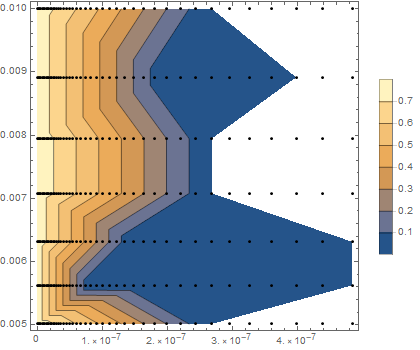
I am using ListContourPlot to plot a list with each element of format {r,t,z}. The results of ListContourPlot do not display all data. However, when I select a particular value of t and use ListPlot, I do see the expected values. Can someone tell me why ListContourPlot is not showing the right contours?
I am using the following commands for plotting
ListContourPlot[data, PlotLegends -> Automatic, Epilog -> {Point@data[[All, {1, 2}]]}]

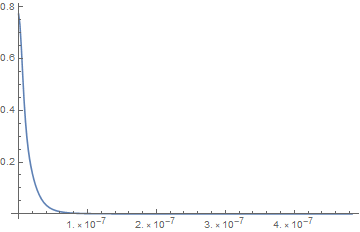
ListLinePlot[{Transpose[{Select[data, #[[2]] == .01 &][[All, 1]],
Select[data, #[[2]] == .01 &][[All, 3]]}]}]
yielding

and

As you can see, there are in fact data points in the empty areas of the ListContourPlot.
Also, notice in the list plot corresponding to t=0.01, z should be less than 0.2 for r>2*10^-8, but the contour plot gives a much higher value.
The data is available at https://pastebin.com/raw/uyLvUcb3
data = Get["https://pastebin.com/raw/uyLvUcb3"];
