- Without having access to your actual code & data, you're asking for people to help debug by glancing at your image. You'll get better answers if you include a small working example that gets at your problem. (People like to tinker). Worst case you can always paste your full example into pastebin or gist.
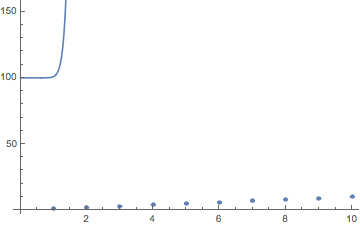
Show has the plot range default to the first object, and you seem to have drastically different scales. In this case it looks like your y-intercept occurs higher than the scale of your error list plot.
I can reproduce with the following:
Here I'll plot the bigger one first so you can see all the data is actually there (if difficult to parse):
Show[Plot[{100 + x^13, 1000 + x^7}, {x, 0, 10}],
 ErrorListPlot[Table[{i, RandomReal[0.5]}, {i, 10}]]]
yields:

Now let's see what happens when we do something similar to what you seem to have going on:
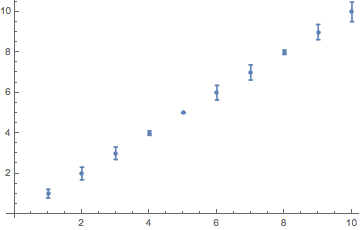
Show[ErrorListPlot[Table[{i, RandomReal[0.5]}, {i, 10}]],
 Plot[{100 + x^13, 1000 + x^7}, {x, 0, 10}]]
yielding:

Note: Since we are stuck to the scale of the error list plot, and the other plot doesn't start until the y-axis is greater then 100 we don't see any of it.
We can start smashing them together by manually enlarging the plot range:
Show[ErrorListPlot[Table[{i, RandomReal[0.5]}, {i, 10}]],
 Plot[{100 + x^13, 1000 + x^7}, {x, 0, 10}], PlotRange -> {0, 150}]

In this case things really don't belong on the same plot. Maybe your data won't look so crazy when you include your PlotRange->{0,3}


Show[ErrorListPlot[Table[{i, RandomReal[0.5]}, {i, 10}]], Plot[{x^2, x}, {x, 0, 10}]]$\endgroup$