2
$\begingroup$

Suppose I have some data ranging from -xRange to xRange:

fooData := Table[{i - xRange, RandomReal[]}, {i, 2*xRange-1}];
sampleFoo = Table[fooData, {i, 1, 100}];

where xRange is some integer. Suppose I want a histogram of the distribution of data at x = 0, i.e. at the xRange-th element of the list:

histData = Histogram[sampleFoo[[All, xRange, 2]], BarOrigin -> Left];

When I plot it (in my init.m file I set options for plots such that they always show frames instead of axes) I'd like the histogram to be on the left edge of the frame. Instead, this

Show[ListPlot[sampleFoo, Joined -> True, PlotStyle -> Directive[Opacity[0.1]]], 
    histData]

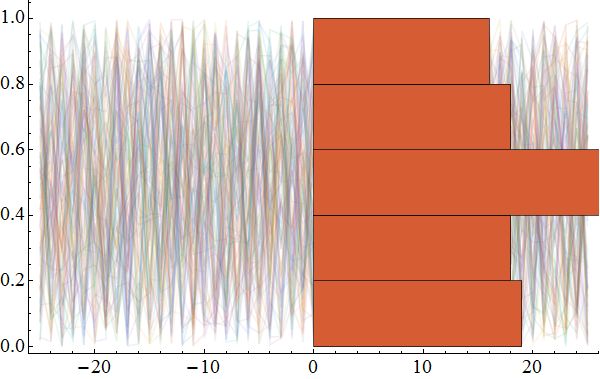
gives me the histogram placed at x=0, rather than where I want it to be.

Output image

Is there any way to do this?

$\endgroup$
2
  • $\begingroup$ Does this thread help? $\endgroup$
    – corey979
    Commented Aug 11, 2017 at 15:22
  • $\begingroup$ That is very similar to what I was trying to do, and with a bit of tweaking might actually work just fine. Thanks! $\endgroup$
    – Enzo
    Commented Aug 11, 2017 at 15:25

1 Answer 1

3
$\begingroup$

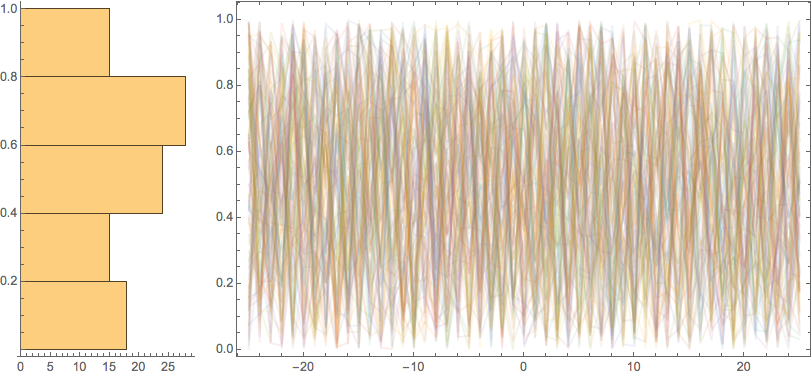
Will this work for you?

SeedRandom[42];
Module[{xmax = 25, n = 100, data, sample, hist, plot}, 
 data := Table[{i, RandomReal[]}, {i, Subdivide[-xmax, xmax, 2 xmax]}]; 
 sample = Table[fooData, {i, 1, n}];
 hist =
   Histogram[sample[[All, xmax, 2]], {.2},
     AspectRatio -> 2,
     BarOrigin -> Left,
     ImageSize -> {Automatic, 300}];
 plot = 
   ListLinePlot[sample,
     Axes -> None,
     PlotStyle -> Opacity[0.1],
     Frame -> True,
     ImageSize -> {Automatic, 300}];
 Row[{hist, "  ", plot}]]

plot

$\endgroup$

Not the answer you're looking for? Browse other questions tagged or ask your own question.