1
$\begingroup$

There is a list

{{5.667680905429296, 4.978997738176498}, {6.062672641119444, 4.821312039084925}, {6.463307024854181, 4.616923216296398}, {6.869389071217502, 4.358024801663491}, {7.280737790273085, 4.0328205724875374}, {7.697184816760531, 3.6220668338026347}, {8.118573184417112, 3.090204786097973}, {8.544756235833926, 2.354492374103027}, {8.97559665513716, 1.045159976700232}, {9.168625618559851, 6.355895552341976^-16}, {9.291801857401657, 6.34776334121662^-20}}

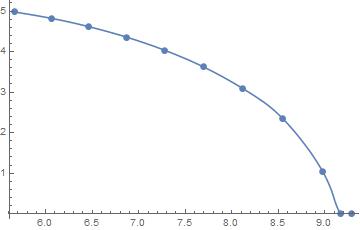
in the form {x,y}. I interpolate the list using Data=Interpolation[{x,y}]. I want to plot the interpolated function as the dependence y(x). How can it be done?

$\endgroup$

3 Answers 3

5
$\begingroup$

Writing:

points = {{5.667680905429296, 4.978997738176498}, 
          {6.062672641119444, 4.821312039084925}, 
          {6.463307024854181, 4.616923216296398}, 
          {6.869389071217502, 4.358024801663491}, 
          {7.280737790273085, 4.0328205724875374}, 
          {7.697184816760531, 3.6220668338026347}, 
          {8.118573184417112, 3.090204786097973}, 
          {8.544756235833926, 2.354492374103027}, 
          {8.97559665513716, 1.045159976700232}, 
          {9.168625618559851, 6.355895552341976^-16}, 
          {9.291801857401657, 6.34776334121662^-20}};

f = Interpolation[points, InterpolationOrder -> 2];

Plot[f[x], {x, points[[1, 1]], points[[11, 1]]}, 
           Epilog -> Point[points], 
           AxesLabel -> {x, y}]

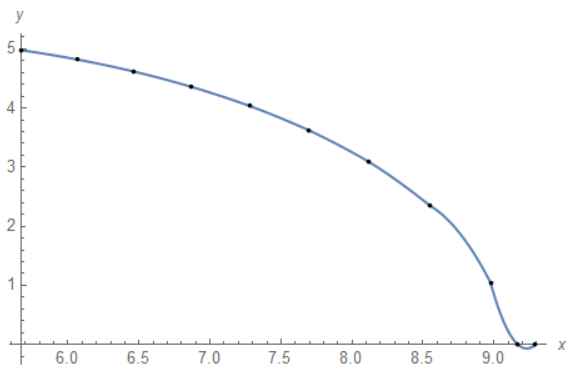
I get:

enter image description here

which is what you want.

$\endgroup$
1
  • $\begingroup$ Why is it not smooth? $\endgroup$
    – Tursinbay
    Commented Jul 12, 2017 at 14:49
1
$\begingroup$

You might want to use InterpolationOrder

ListLinePlot[points, InterpolationOrder -> 2, Mesh -> Full]

enter image description here

$\endgroup$
1
$\begingroup$

Here shows the resulting curves and smoothness of the Interpolation with change in the degree of the polynomial from 0 to 5

Plot[Evaluate@Interpolation[points, InterpolationOrder -> #][x], {x, 
    points[[1, 1]], points[[11, 1]]}, Epilog -> Point[points], 
   AxesLabel -> {x, y}] & /@ {1, 2, 3, 4, 5}

Here are the results

enter image description here

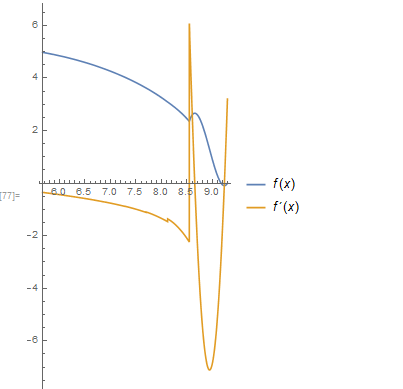
Also, by taking a good look at the first derivative is a good indication of where in the independent variable x range may need further additional points to get a good quality interpolation.

   f = Interpolation[points]; {xmin, xmax} = 
 MinMax[points[[All, 1]]]; Plot[{f[x], f'[x]}, {x, xmin, xmax}, 
 AspectRatio -> 2, PlotLegends -> "Expressions"]

enter image description here

$\endgroup$
4
  • $\begingroup$ The yellow curve is the 1st derivative of the interpolation function, but I do not know how to correctly label this in WM $\endgroup$ Commented Jul 12, 2017 at 16:05
  • 1
    $\begingroup$ f = Interpolation[points]; {xmin, xmax} = MinMax[points[[All, 1]]]; Plot[{f[x], f'[x]}, {x, xmin, xmax}, PlotLegends -> "Expressions"] $\endgroup$
    – Bob Hanlon
    Commented Jul 12, 2017 at 16:19
  • $\begingroup$ Thank you Bob.. but this just place the Interpolation function . I really need to use a custom label ( f(x) and f'(x) ) $\endgroup$ Commented Jul 12, 2017 at 17:14
  • $\begingroup$ With the code that I posted the PlotLegend shows f(x) and f'(x), Perhaps you need to Clear[f]. $\endgroup$
    – Bob Hanlon
    Commented Jul 12, 2017 at 17:20

Your Answer

By clicking “Post Your Answer”, you agree to our terms of service and acknowledge you have read our privacy policy.

Not the answer you're looking for? Browse other questions tagged or ask your own question.