Revision
Contrive some data.
SeedRandom[42];
With[{n = 42},
  data = Transpose[{RandomReal[1., {n, 2}], RandomSample[Range[100], n]}]];
Short[data, 3]
{{{0.425905, 0.391023}, 51}, <<40>>, {{0.359445, 0.00772549},24}}
Separating the points from the labels.
pts = data[[All, 1]];
lbls = data[[All, 2]];
Generating the convex hull.
ch = ConvexHullMesh[pts];
Extracting the boundary point labels.
bpts = MeshCoordinates[RegionBoundary[ch]];
blbls = Extract[lbls, Flatten[Position[pts, #] & /@ bpts, 1]]
{94, 36, 21, 1, 88, 2, 14, 24}
Making the labels into graphics elements.
labels = MapThread[Text[#1, #2] &, {blbls, bpts}];
Showing the combined graphics.
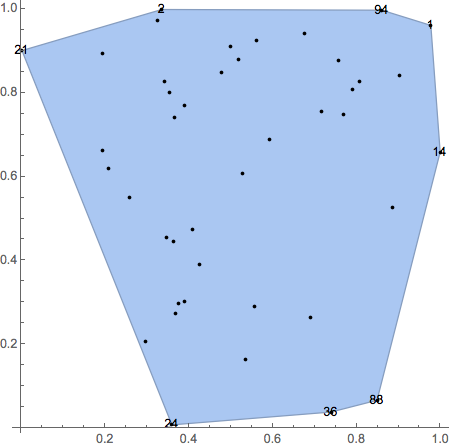
Show[ch, Graphics[{Point[pts], labels}], Axes -> True]

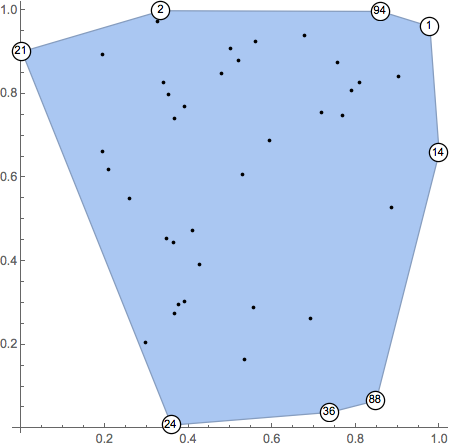
Of course, the labels can be fancied up by using Inset rather than Text
labels =
  MapThread[
    Inset[
      Graphics[{FaceForm[White], EdgeForm[Black], Disk[], Text[Style[#1, 9]]}],
      #2, Automatic, Scaled[.0475]] &,
    {blbls, bpts}];
Show[ch, Graphics[{Point[pts], labels}],
  Method -> {"AxesInFront" -> False}, Axes -> True]


